Download
1 / 29
310 likes | 505 Views
Partial Equilibrium Trade Model, Gains from Trade, Trade Elasticities & impacts of country interventions. Lectures 9 & 10 AHEED Course “International Agricultural Trade and Policy” Taught by Alex F. McCalla, Professor Emeritus, UC Davis. April 2 & 5 , 2010, University of Tirana, Albania.

E N D
Partial Equilibrium Trade Model, Gains from Trade, Trade Elasticities & impacts of country interventions Lectures 9 & 10 AHEED Course “International Agricultural Trade and Policy” Taught by Alex F. McCalla, Professor Emeritus, UC Davis. April 2 & 5 , 2010, University of Tirana, Albania
Edgeworth Box & Allocation of Resources LF OF C TC TF F OC LC Increasing Increasing Increasing Increasing Labor used in food production Land used in food production Land used in cloth production Labor used in cloth production
Relationship between Gen. Equilb. & Partial Equilb. Model, deriving the supply curve Slope of PPF is cloth’s opp. cost (mrt) Wheat, bushels Cloth, yards Supply Bushels/yard Cloth, yards
Deriving demand curves from indifference curves Wheat, bushels I -Pc/Pf Cloth, yards Bushels/yard D Cloth
From General to Partial Equilibrium Wheat, bushels Cloth, yards S Bushels/yard D Cloth
Comparative advantage under increasing opportunity cost Home Foreign Wheat, bushels Wheat, bushels Cloth, yards Cloth, yards SHome SFor Bushels/yard Bushels/yard Cloth, yards Cloth, yards
Review of Producer Surplus Producer surplus = quasi rent, or excess of gross receipts over TVC. R= TR- TVC Defined as the area above the supply curve & below the price line price S PS Q
Review of Consumer Surplus Consumer utility is not observable, so economists try to compute a money-based measure of welfare effects. CS gives the change in what the consumer is willing to pay over that which is actually paid. price P0 P1 Demand q0 Q q1
Generating Excess Supply & Excess Demand Functions in World Market InternationalMarket Home Foreign price S price price S ES PT ED D D QT Q Q Q
Elasticity of Import Demand -(Excess Supply) Elasticity of excess supply (ES) & excess demand (ED) functions are derived from domestic supply Sd and domestic demand Dd functions. ED = Dh – Sh; and ES = Sf – Df Thus the slopes of ED & ES are derived from Dh, Sh & Sf ,Df dED = dDh – dSh dES = dSf - dDf dp dp dp dp dp dp And Therefore so are the elasticities of ED & ES derived from elasticities of the domestic functions. Let E =elasticity Recall elasticity of Dh = Ehd = dq * p dp q As shown in McCalla and Josling pp41 & 42 EED = E Dh * Home Con/Imports – E Sh* Home Sup/Imports E ES = E Sf * For Sup/Exports – E Df * For Con/ Exports.
Elasticity of Import Demand (Excess Supply) Let us give a numerical example; Suppose a country imports 25 % of its wheat consumption Let S = share of imports in domestic demand IM/Dh; and 1-s is share of consumption supplied domestically So Home con/imports = 1/s; Home sup/ imports = 1-s & if EDh = -.2 and E Sh = .2 The elasticity of Excess Demand EED = (1/.25 *-.2) - .2 * .75/.25 Which =(4 X -.2) = -.8 + - .6 (.2 X 3) = -1.4 What is obvious is that even though both domestic supply and demand are highly inelastic, import demand is elastic. In general can say Import Demand is more elastic; a. the more elastic domestic demand; b. the more elastic domestic supply; c. the smaller the market share of imports.
Lecture 10: Modeling Country Interventions Foreign International Market Home S price price price S ES ED D D Q Q Q
Transmission of Shocks Country B Experiences a short crop- Shifts Sb to Sb’ which shifts Ed out to Ed’ Raising world price to P’w and expands trade to 08 Note both countries adjust
Imposition of a unit tariff –same impact as introducing a transport cost. The imposition of a tariff t by country B shifts Ed to E’d; Price in exporter A falls from Pw to P’w & exports contract; Price importer B rises to P’baand imports contract; B collects tariff revenue of (P’b –P’w) X Q’
Impact on excess supply of exporter fixed-price policies. Suppose Ex A fixes producer prices at P, thus domestic supply becomes S’a and excess supply becomes E’s; if also fixes P to consumers excess supply becomes perfectly inelastic -E”s. If P is floor price for both producers and consumers excess supply becomes E”s below P and Es above P Lesson – Domestic price intervention reduces the elasticity of Es
Impact on excess demand of importer fixed-price policies Is mirror image from exporter case- if Im B fixes producer price at Pp excess demand rotates to E’d, fixing Pp also to consumers makews excess demand perfectly inelastic E”d. The lesson for world markets is the more rigid domestic intervention the inelastic world S & D functions will be = more price instability in world markets
World Market Impacts of Guaranteed Producer Prices. Put together, guaranteed producer prices in both exporters and importers rotates Es to E’s and Ed to E’d, world trade contracts from Q to Q’ and world price falls from Pw to P’w. Note that because intervention decreased the elasticities of both excess functions, the change in price is greater than the change in quantity, i.e. domestic intervention increases price instability in World Markets
Distribution of the effects of supply shocks in both countries In (a) the short harvest in Im. B reduces supply in Im.B by AB , the adjustment in the world market can be decomposed: -BC is reduced import demand due to price increase and AC is increased export supply in response to the price increase
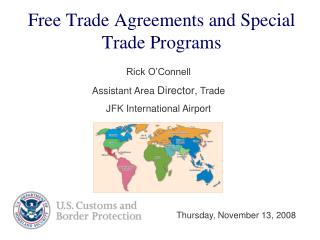
Optimal Export Tariff World Market P S • Why is MR below ED? • How do we measure social • return from additional exports? P*= P(1+τ) PF P ED MR Q
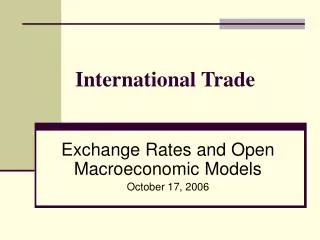
Optimal Import Tariff World Market P MO • Why is Marginal Outlay above S? • What is the true cost of an additional • unit of imports? S P= P*(1+τ) P* ED Q
Tariff v Quota Equivalence: large country P P World Market S Home ES PF ED D | | Q Q For quotas, welfare effects depend crucially on how import licenses are distributed. e.g., a) Auction quotas (Australia); b) Assign Import rights to home firms (Japan, Indonesia; Canada) c) Give licenses to foreigners (USA).
Import Quota & Domestic Monopolist Unlike with a tariff, Monopolist is now free to prices Domestic Market P Imports } S Pq Quota rent Quota shifts D left by amount of quota PF D Dq MRq Q
Tariff v Quota that leads to same level of imports Domestic Market P Quota shifts D left by amount of quota S Pq Unlike with a tariff, Monopolist is now free to prices PF + τ PF D MR Dq | | 0 Q Quota creates more monopoly power than tariff Qq Qt QF } Imports
D Source: David Skully
World bound agricultural tariff averages, by region Source:www.ers.usda.gov/db/Wto/WTOTariff_database/
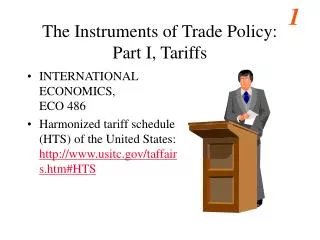
Tariff Escalation & Effective Rate of Protection S Price D Value added = Final value of good - value of imported inputs. v = p - p, where is share of imported inputs in final value. ERP = (v’ -v)/v P*b = $1,600 T Pbeef = $1,000 (foreign supply) S G Pcorn = $500 (foreign supply) 0 Qcorn,beef Nominal rate of protection = ST/OS = 60% Effective rate of protection = ST/GS = 120%
Tariff Escalation • Higher import duties on semi-processed & finished products than on raw materials. • e.g., Cocoa enters US duty free but there is a relatively high tariff on the processed product chocolate. • Instant coffee v coffee beans is another example. Source: Oxfam