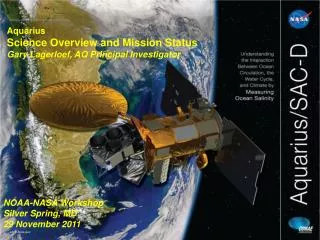
Aquarius/SAC-D Science Meeting Seattle, WA 19-22 July 2010
College of Engineering Department of Atmospheric, Oceanic & Space Sciences. Aquarius/SAC-D Science Meeting Seattle, WA 19-22 July 2010. Aquarius Radiometer RFI Algorithm. Chris Ruf Space Physics Research Laboratory Dept. of Atmospheric, Oceanic & Space Sciences University of Michigan

Aquarius/SAC-D Science Meeting Seattle, WA 19-22 July 2010
E N D
Presentation Transcript
College of Engineering Department of Atmospheric, Oceanic & Space Sciences Aquarius/SAC-D Science MeetingSeattle, WA19-22 July 2010 Aquarius RadiometerRFI Algorithm Chris Ruf Space Physics Research Laboratory Dept. of Atmospheric, Oceanic & Space Sciences University of Michigan cruf@umich.edu, 734-764-6561 (V), 734-936-0503 (F)
Outline • Description of Aquarius RFI Flag Algorithm • Examples of SMOS RFI
Qualitative Description of Algorithm • The RFI detection algorithm is a “glitch detector” which identifies samples that deviate anomalously from the average of their neighbors • Adjustable parameters of the algorithm address • How many neighboring samples to use to determine the local average • Which neighboring samples to exclude from the average due to possible RFI contamination • How large a deviation from the local average constitutes the presence of RFI • Which (if any) other samples near a contaminated sample should also be flagged as contaminated even if they are not flagged directly by the algorithm
Relevant Aquarius Data Sampling Parameters • Calibrated TB samples are measured every 10ms • Satellite ground track velocity is ~ 7.5km/s • Radiometer HPBW footprint diameters are ~ 85, 102 and 125 km • Derived relationships • A very sharp TB feature, such as a coastal crossing, requires approximately 13 seconds (= HPBW/vgroundtrack) to develop in the Aquarius image • There will be approximately 1300 TB samples taken during a coastal crossing transition
Example of Algorithm Performance • Data Set E (simulated coastal crossing w/ single RFI event at coastline) • Algorithm parameters: Ws=20, Tm=1.5, Tdet=4, Wr=Wf=5 • Single RFI event successfully detected; false alarms still present
Pre-launch Algorithm Parameter Values • Algorithm parameters and suggested nominal values are: • Averaging window for local mean TB value: Ws=20 • Mean threshold to select clean TBs for local mean: Tm=1.5 • Detection threshold to decide if RFI is present: Tdet=4 • Neighborhood of detected RFI also flagged: Wr=Wf=5 • Tdet has the most significant effect on performance • Coastal crossing can trigger false alarms if Tdet is set too low • Missed detections will result if Tdet is set too high • Algorithm has capability for lat/lon dependent parameters with 1 deg resolution • Currently all the same pending SMOS analysis
SMOS RFI Impulse Response Test • Pulse a controlled RFI source on and off during SMOS overpass • Half-wave crossed dipole with circular Pol’z • Antenna borsesight pointed at center of SMOS FOV • TB ~ 450 K • Period of modulation = 3 x smallest SMOS integration time (so at least one known integration is 100% ON and OFF) • ON – OFF difference resolves RFI impulse response • Small changes in incidence angle from ON to OFF add background residual error
SMOS H-pol TB Image Animation During RFI Impulse Response Test
SMOS H-pol TB Time Series and RFI Impulse Response Images Time series of TBH at RFI location ON-OFF TBH difference (close up of RFI at right)
SMOS H-pol TB RFI Impulse ResponseTransects along three 120o principle planes
SMOS “Peak Hold” Detected RFI ImageLand V-Pol during 5-11 June 2010
SMOS “Peak Hold” Detected RFI ImageOcean V-Pol during 5-11 June 2010