Download
1 / 30
300 likes | 543 Views
Aquarius Science Overview and Mission Status Gary Lagerloef, AQ Principal Investigator. NOAA-NASA Workshop Silver Spring, MD 29 November 2011. Outline. “ 1st light image” Project status, commissioning and orbit Cal/Val issues Aquarius Data Processing stages

E N D
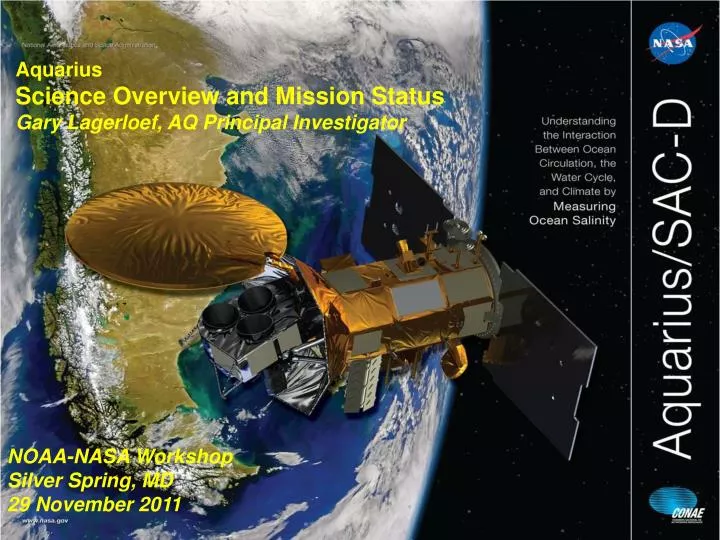
Aquarius Science Overview and Mission Status Gary Lagerloef, AQ Principal Investigator NOAA-NASA Workshop Silver Spring, MD 29 November 2011
Outline • “1st light image” • Project status, commissioning and orbit • Cal/Val issues • Aquarius Data Processing stages • Data product versions and reprocessing
“First Light” Global Salinity Map
1 Week Average Version 1.2 data
4 Week Average Version 1.2 data
2 Month Average Version 1.2 data
Things to be aware of … Island and coastal halos Streaks: Ascending-descending biases and other issues Noisy Southern Ocean data due to high wind and low SST Version 1.2 data
Mission Design and Measurement Approach Sun-synchronous exact repeat orbit 6pm ascending node Altitude 657 km • Global Coverage in 7 Days • 4 Repeat Cycles per Month Beams point toward the night side to avoid sun glint Science Data Validation More than 300 surface validation observations per day 390 Km (242 Mi) Salinity Data 150km, Monthly, 0.2 (psu)
Post Launch Activities and Status • Liftoff: 10 June 2011, 07:20:13 PDT • 10 June – 20 July: Service Platform Commissioning • 21 Jul – 13 Aug: Propulsion calibration and initial altitude correction • 14-24 Aug: Aquarius antenna deployment and commissioning • 25 Aug: Aquarius instrument is fully functional (3 months data processed to-date) • 26 Aug – 9 Sep: SAC-D Instruments commissioning • 10 Sep – 15 Oct: Final orbit adjustments (some off-pointing data loss) • 16 October: Nominal Aquarius science operations begin • 16 Oct – 30 Nov: Various reviews to close Commissioning Phase • 1 December 2011: Begin Aquarius 3-year Baseline Mission • 11-13 April 2012: Next Aquarius/SAC-D Science Meeting, Buenos Aires
Orbit Adjustments • The following table lists the final orbit adjustment propulsion maneuvers during Sep-Oct 2011. • Each burn was preceded and followed by attitude changes (roll-pitch-yaw), which can be seen in the L2 data file and screened. • Science Orbit: 7-day (103 orbits), “exact repeat” (+/- 20 km), sun-synchronous, ascending node at 1800 mean local time, nominal primary ascending node = 39.84 E longitude.
Calibration/Validation Issues • Pointing Biases • Calibration Drift in Version 1.1 • Wind speed and direction affects • High latitude (low SST, high wind) deviations • Ascending-descending biases • Algorithm updates: status and plans
Pointing Offset Summary • Alex Fore (NASA/JPL) analyzed the pointing angle offsets: • Stable to within 0.1 degrees over time (week to week) • Both the scatterometer and radiometer data yield consistent results • Alex’s results being verified by others on the cal/val team before implementing corrections in future algorithm code updates *Hard to tell the difference
Versison 1.1 Calibration Drift • Each channel is slightly different, and all show negative drift < 0.1K/week (L3 requirement). • Four consistent independent analyses; one (Chris Ruf) is vicarious calibration w/out reference salinity data • All records normalized to 8/28/11
Version 1.1 Calibration Drift August September October November
V 1.2 Empirical Drift Correction • Orbit by orbit bias correction using a running 7-day global average Ta – Taexpected, Descending passes only • Taexpectedis based on HyCOM model salinity and forward radiative transfer model. Corrected Un-corrected
V 1.2 Empirical Drift Correction: Buoy validation Trend of dSSSV1.2 (radiometer – in situ) 08/29-10/24 Trend of dSSSV1.1 (radiometer – in situ) 08/25-10/17
Wind Direction Signal T, Meissner and F. Wentz, Remote Sensing Systems E0: specular emissivity using Meissner – Wentz dielectric model
Wind Speed and Direction Signal • Meissner and Wentz, RSS • 5th order polynomial fit. • 2nd harmonic direction signal noticeable above 10 m/s. • 1st harmonic v-pol present • No 1st harmonic h-pol. • Wind speed only is included in V1.1 and V1.2 Level 2 processing • Directional affects to be added in V1.3 VH
High Latitude Deviations Kao & Lagerloef, ESR Large deviations with buoy matchups likely caused by NCEP wind speed and direction errors at low surface temperatures.
Ascending – Descending Bias Kao & Lagerloef, ESR dSSS (ascending – descending) Landf/icef>0.005 roll and pitch off-nadir (>0.2 and <-0.2 degrees) are filtered
Ascending – Descending Buoy Matchups Time series of the daily median bias No bias Kao & Lagerloef, ESR
Differences in Salinity / Precipitation (Ascending - Descending) P. Xie, NOAA Aquarius
Science Data Processing • The Aquarius science data processing consists of the following steps: • Level-0 Preprocessor – process each HRD downlink file to produce a single time-ordered set of Aquarius science blocks and removes duplicates– developed by Joel Gales - ADPS. • Level-0-to-1A – separate Level-0 files into orbits, unpack science data, incorporate overlapping ephemeris and SAC-D HKT and convert Aquarius HKT – developed by Joel Gales - ADPS. • Level-1A Merge – consolidate Level-1A files from overlapping downlinks into a single, best-quality full orbit product – Joel Gales - ADPS. • Level-1A-to-2 – perform calibration, atmospheric correction and salinity retrieval for Aquarius science data – radiometer and scatterometer code delivered by RSS and JPL, respectively; integration and input/output code developed by Joel Gales and Liang Hong - ADPS. All reprocessing occurs at this level. • Level-2-to-3 Binning – Level-2 salinity retrievals for one day geographically projected and collected into equal-area bins – existing OBPG software modified by Joel Gales- ADPS. • Level-2-to-3 Smoothing – Level-2 salinity retrievals for one day optimally interpolated 150 km scale – algorithm by ESR, implemented by Joel Gales – ADPS, still under evaluation and test. • Level-3 Binning and Mapping – Level-3 binned files aggregated to longer time periods (weekly, monthly, etc.) and projected onto map grid – existing OBPG software. • All processing steps are run automatically when all input data sets are available.
Processing Status and Plans • Running V1.1 code operationally; 2-3 day latency • First post-launch re-calibrations in early September after preliminary analyses: • Noise Diode Temperatures Adjusted to remove overall bias for last week of August 2011 • Antenna pattern correction re-adjusted to values obtained from theoretical antenna patterns. • New Wind-Induced Emissivity Model Based on Aquarius Tb and F17 winds • V-pol Only Salinity Retrieval Algorithm • Now known to have a calibration drift relative to late August • Uses NCEP ancillary winds, but no wind direction applied • V1.2 (with empirical radiometer bias correction, updated scatterometer wind and flags). • Delayed mode; currently available through 9 November 2011. • Expect to be phased out after V1.3 (below) • V1.3 expected changes post cal/val workshop (mid-Dec) • Implement internal radiometer drift correction model • Discontinue empirical ‘reference salinity’ drift correction • Shift from NCEP winds to hybrid with scatterometerwinds • Implement wind direction (azimuth) correction • Some updates to L2 parameters and names • V1.4, V1.5, V1.6, …. as required • V2.0 will probably be implemented late spring 2012, after Buenos Aires Science Meeting.
Aquarius/SAC-D Observatory Microwave Radiometer MWR Satélite de Aplicaciones Científicas-D Service Platform SAC-D S/P NIRST Mass: 1329 Kg Power:1320 W Oper. Life: 5 yrs Aquarius (primary instrument) High Sensitivity Camera HSC Data Collection System CARMEN-1 (ICARE-NG & SODAD) Technology Demonstration Package Radio Occultation Sounder for the Atmosphere DCS TDP ROSA
MWR Sampling MWR Footprints AQ Footprints MWR Footprints