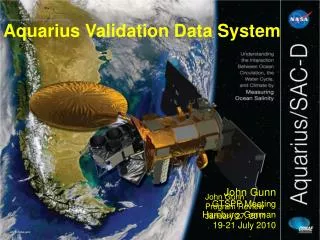
Aquarius Validation Data System
Aquarius Validation Data System. John Gunn GTSPP Meeting Hamburg, German 19-21 July 2010. John Gunn Program Review January 27, 2011. Introduction. Aquarius Validation Data System.

Aquarius Validation Data System
E N D
Presentation Transcript
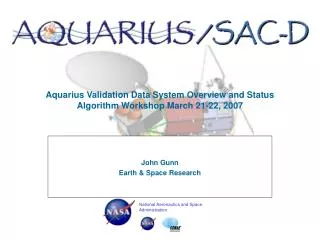
Aquarius Validation Data System John Gunn GTSPP Meeting Hamburg, German 19-21 July 2010 John Gunn Program Review January 27, 2011
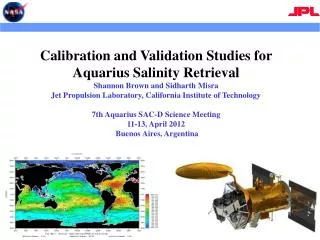
Introduction Aquarius Validation Data System Objective: Collect appropriate in situ surface salinity data for comparison with Aquarius/SAC-D satellite surface salinity measurements and to make this data and associated matchups available to the user community at large. Near real-time in situ data is matched with satellite data coincident in time an space, within specified limits, for each radiometer horn. A closest point of approach (CPA) is calculated and compared with the in situ data.
Mission Design and Sampling Strategy Sun-synchronous exact repeat orbit 6pm ascending node Altitude 657 km • Global Coverage in 7 Days • 4 Repeat Cycles per Month Beams point toward the night side to avoid sun glint In Orbit Checkout 3 beams390 km wide swath. 76 x 94 km 96 x 156 km Salinity Data 150km, Monthly, 0.2 (pss) Mission Requirement 84 x 120 km Launch
CPA Comparison Schematic of single radiometer ground track and buoy CPA 1.44 sec Level 2 satellite data
AVDS Structure How is the data processed?
Web Demo Web Demo
Data Comparisons • Comparing the Aquarius salinity and the ancillary salinity with the in situ measurements can be a method of monitoring performance. • The progression of simple daily statistics can provide a method of examining performance of each beam. • The scatter in the comparison between the Ancillary salinity and the in situ values reflects errors inherent in the point/area average comparison as well as the Hycom model error. • Greater scatter in the Aquarius/in situ comparison can be considered to be associated with the Aquarius measurement.
Statistical Considerations • Examined using mean, median and standard deviation of daily matchups as monitoring statistics • For this dataset, mean wasn’t optimal because of data offsets near land and ice. So we use the median as a better estimator. The mean may be better in subsequent versions. • Similarly the standard deviation was affected by spurious values but this may work better in subsequent versions.
Outstanding issues • Modifications needed in order to ingest evaluations updates. • Initiate version control and tracking. • Decide on optimal racking statistics. • Decisions on data displays and data serving on web site. • Incorporate additional data types. • Web site documentation improvements.
2007 Simulation Data Matchups – Day 1 January 1, 2007
2007 Simulation Data Matchups – Day 2 January 2, 2007
2007 Simulation Data Matchups – Day 3 January 3, 2007
Summary • AVDS web page available for preliminary testing. • http://aquarius.esr.org/avds • Near surface ARGO data used for prelaunch and 2007 Simulation periods. • GTSPP profile data to be incorporated next. • Temporary login name and password is “avds” for both. • Future version will include CPA calculation and matchup data for modeled data. • Send comments and suggestions to gunn@esr.org.
Data Inputs GTSPP GTSPP GTSPP GTSPP In-situ data sources In-situ data sources In-situ data sources In-situ data sources Where do we get the data? Fixed moorings Surface drifters CTD profiles Research ships (TSG) ARGO profile floats
In situ Data vs Sat Matchup Red= in situ position Black circle = Sat CPA
Salinity Differences Histogram of in situ Salinity minus CPA salinity For March 6, 2007 Input data are actual in situ data and 2007 year long simulation salinity data
2007 Simulation Data – 1 Day In situ Salinity Aquarius Salinity
2007 Simulation Data – 1 Day Argo Buoy locations and matchups
International Partnership Satellite Observatory United States – Argentina and other agencies • Service Platform and SAC-D Science Instruments • Mission Operations & Ground System • Aquarius Salinity Microwave Instrument (Instrument Ops + Science Data Processing) • Launch Vehicle
Observatory Configuration Y Anti-Sun Z Nadir XFLT DIR Deployed Configuration Stowed Configuration Aquarius Reflector Aquarius Instrument Delta 7320-10 C Fairing Station location in mm SAC-D Station 4922.0 AQ Station 2382.0 Aquarius Sunshade ROSA SAC-D Service Platform SAC-D Station 2540.0 AQ Station 0.0 NIRST Star Trackers Solar Panel HSC Comm. Antennas MWR Nav-GPS, ROSA, TDP and s-Band Antennas SAC-D Station 0.0 CARMEN-1 (SODAD 1 of 3)
Simulators to be ready in March - April 2010 Science Simulator • New 12-month simulator now being computed for calendar year 2007 ocean • Will be released as Level 2 science data files. Operational Simulator • “real time” data processing of simulated data on a daily basis • Daily data will be released through the Aquarius data website as if the mission were actually flying for science team to analyze. • Early October 2010
AVDS Web page Where is the data available? http://aquarius.esr.org/avds
Data Display Detail 150 lines of data on the screen, CSV file of all selected data available for download
Schedule • Modifications needed in order to ingest evaluations updates (mid March). • Initiate version control and tracking (mid March). • Decisions on data displays and data serving on web site (April). • Incorporate additional data types (April). • Web site documentation (end March).