Download
1 / 4
40 likes | 156 Views
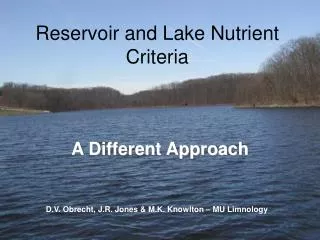
This study investigates the nutrient concentrations in Raystown Lake, a significant reservoir in south-central Pennsylvania. Conducted from July to November 2000, it aimed to profile nitrate and phosphate levels across the lake, correlate these with water quality indicators, and identify nutrient input sources. Findings revealed fluctuations in total phosphate (average 0.18 mg/L) and nitrate (average 0.71 mg/L) concentrations, with notable seasonal changes and site-specific patterns, particularly influenced by input streams. This research enhances understanding of water quality dynamics in this critical ecosystem.

E N D
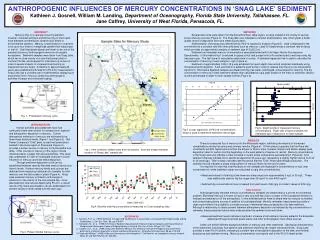
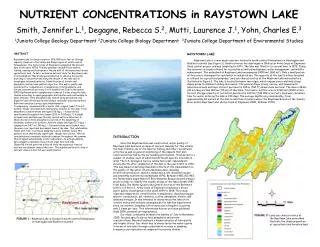
NUTRIENT CONCENTRATIONS in RAYSTOWN LAKE Smith, Jennifer L.1, Degagne, Rebecca S.2, Mutti, Laurence J.1, Yohn, Charles E.3 1Juniata College Geology Department 2Juniata College Biology Department 3Juniata College Department of Environmental Studies ABSTRACT Raystown Lake is a large reservoir (514,000 acre-feet of storage capacity) located in the Valley and Ridge region of south central Pennsylvania. The Army Corps of Engineers completed the present dam in the early 1970s. Primary purposes include flood-control, fishing, boating and hydropower. Nearly half of the watershed drains agricultural land. To date, extensive nutrient data for Raystown Lake is not published.This study was conducted to obtain a horizontal profiling of concentrations along the length of the lake and to investigate seasonal patterns. Identification of nitrate and phosphate sources was another objective. The water quality was monitored for temperature, transparency, total phosphate, and nitrate concentrations every 2 to 4 weeks from July to November 2000. Epilimnion water samples were taken at 6 sites along the lake, chosen according to equal geographic distribution and relationship to input streams. Total phosphate was tested using persulfate acid digestion and nitrate was tested using a cadmium reduction method. Both were analyzed using a spectrophotometer. Transparency, measured with a seechi disk, ranged from 1.5 to 6.9 meters. Values increased with decreasing distance to the dam. Total phosphate concentrations averaged 0.18 mg L-1. Values varied significantly throughout the season (0.01 to 0.38 mg L-1). A slight increase near mid-lake was the only spatial pattern detected. A sharp decline in total phosphate occurred at the beginning of November before fall turnover. Nitrate values averaged 0.71 mg L-1, ranging from 0.47 to 1.00 mg L-1. Concentrations were highest near the main river input and decreased toward the dam. This relationship faded with time. A previous sampling in early summer found this pattern to be statistically significant, though ours did not. Nitrate concentrations remained relatively constant throughout the summer then dropped substantially in late September. As with phosphate, data suggests a possible local nitrate input near mid-lake. Observed nitrate patterns differed from the expected trend of nutrient enrichment toward the river. The sudden and drastic drop in nutrient values in mid-fall was unanticipated. RAYSTOWN LAKE Raystown Lake is a man-made reservoir located in south-central Pennsylvania in Huntingdon and Bedford counties (see Figure 1). Construction on the dam began in 1968 as an Army Corps of Engineers flood control project and was completed in 1973. The lake was filled to its current level in 1975. Today the reservoir is largely utilized for recreation as well as hydropower, water management, and wildlife enhancement. The watershed of Raystown Lake encompasses 2490 km2 (960 mi2). Only a small portion of this area is developed for residential or industrial use. The majority of the land is either forested or utilized for agricultural purposes. Land use characteristics of the Raystown Lake watershed are illustrated in Figure 2. The lake is located between two ridges, which expose some relatively steep slopes prone to sediment sliding and erosion. The general shape is long, narrow, and sinuous with numerous alcoves and bays. Current pool level is 240 m (780 ft) above mean sea level. The lake is 48 km (30 mi) long and has 190 km (110 mi) of shoreline. Total water surface area is 3360 hm2 (8300 acres). Current storage capacity at recreation-pool level is 630 hm3 (514,000 acre-feet). Hydraulic residence time for water entering the lake is 230 days. The average depths vary considerably, from approximately 60 meters at the dam to less than 2 meters where the Raystown Branch of the Juniata River enters Raystown Lake (Army Corps of Engineers 2000, Williams 1978). INTRODUCTION Since the Raystown Dam was constructed, water quality of Raystown Lake has been an issue of concern. Reasons for this include the high intensity use of the lake for fishing and other recreational activities as well as general monitoring of the impacts that dam construction has had on the surrounding environment. This has led to a number of studies, each of which had different specific interests in mind. The U.S. Geological Survey conducted a post-impoundment survey shortly after completion of the dam in the years 1974 to 1976. This was aimed at defining immediate effects of the impoundment on the quality of the water. It provided base data, including stratification behavior, specific conductance, pH, dissolved oxygen and bimonthly nutrient levels (Williams 1978). Between 1985 and 1987, the Pennsylvania Department of Environmental Resources performed a study in order to classify the trophic status of the lake (Schott 1987 from Kulp). The Water Quality and Control Section of the Baltimore District of the U.S. Army Corps of Engineers conducted a broad water quality investigation in the years 1994 to 1998. This study reported temperature, stratification, transparency, dissolved oxygen, specific conductance, pH, alkalinity, acidity, phosphate, nitrate, and ammonia nitrogen. It was intended to characterize the lake at its current status and evaluate consequences the lake has experienced since its creation. Sampling in this study was infrequent, occurring only 3 times per year. This information has not yet been published (Kulp 2000, personal correspondence). Our study, conducted between the months of July to November 2000, focused specifically on total phosphate and nitrate concentrations. Nutrient loading is a known indicator of lake quality and trophic status. Our intent was to characterize the water quality in terms of nutrients through a substantial increase in sampling frequency and replication as compared to previous studies. FIGURE 2:Land-use characteristics of the Raystown Lake watershed illustrate the dense proportion of agricultural and forested land FIGURE 1:Raystown Lake is located in south-central Pennsylvania in Huntingdon and Bedford counties
RESULTS Transparency- Transparency decreased linearly with distance from the dam. Seechi values ranged from 6.9 to 1.5 meters. Average seechi depths at individual sites is shown in Figure 4. METHODS Sampling - We collected epilimnion samples to analyze for nitrate and total phosphate every 2 to 4 weeks for a total of 6 times from July to November 2000. Samples were collected at 6 sites throughout the lake, chosen to reflect spatial distribution and relation to major input streams. Sites were located at 0,3,9,13,18, and 22 miles from the dam. The sampling sites are illustrated in Figure 3. Water depth at the sites ranged from 15 to 60 meters. Epilimnion samples were collected from a depth of 2 meters at all sites. A well-defined thermocline occurs at approximately 8 meters throughout the lake, so we were confident that these samples were unaffected by any mixing that occurred with the metalimnion. We used a kemerer bottle to obtain replicate samples from each site. Samples were kept on ice in glass sampling bottles until processing, which occurred later that day. Weekly sampling included measurement of transparency with a seechi disk. The disk was lowered into the water until it was no longer visible, then raised until it could be seen again. This depth was the recorded transparency. Temperature, dissolved oxygen content, and conductivity were also recorded on a weekly basis as another part of this study. These readings were taken at the surface and at every meter until either 29 meters or the bottom was reached. Laboratory procedures – Nitrate concentrations were analyzed using a cadmium reduction method followed by spectrophotometric analysis. The test is used to detect concentrations between 0.0 and 30.0 mg L-1 nitrate. Total phosphate in unfiltered samples was tested using a persulfate acid digestion method and then analyzed for orthophosphate concentrations using a spectrophotometer. This method is suggested for concentrations between 0.00 and 2.50 mg L-1. Measures were taken to calibrate the spectrophotometer prior to analyses. Data analysis – We performed statistical analyses on all of the data collected. Box plots were used to identify statistical outliers after each sampling. These outliers were not included in the final averages reported. Statistical analyses were also performed on final averages to identify significant differences between individual values, both temporal and spatial. These data sets were tested for equal variance prior to pairwise comparisons. In all cases, a p-value of 0.05 or lower was considered a significant difference. Regression analyses were used to test for linear trends. FIGURE 4: Average seechi depths at each site show a strong pattern of decreasing transparencies upstream RAYSTOWN DAM concentration, mg/L RIVER (R22) JUNIATA RIVER 25-Jul 1-Aug DAM (R1) 14-Aug 6-Sept 29-Sept 4-Nov FIGURE 3: Sites sampled for nitrate and total phosphate were distributed throughout the lake to reflect spatial distribution and location relative to input streams FIGURE 8: A 3-D plot of total phosphate concentrations shows the temporal pattern that was observed as well as the lack of any significant spatial pattern in the lake
Nitrate- Nitrate values averaged 0.71 mg L-1 for the entire study, ranging from 0.47 to 1.00 mg L-1. Figure 5 illustrates both temporal and spatial patterns over the sampling period. This range was produced due to values varying over time and slightly by location. In late July, we observed a significant linear pattern of decreasing nitrate with distance downstream. Values ranged from a high of 1.00 mg L-1 near the main river input to a low of 0.60 mg L-1 near the dam. This spatial pattern faded with time and was no longer significant by September. Figure 7 depicts this disappearing pattern from June to November. Over the course of the sampling period, nitrate concentrations throughout the entire lake seemed to increase slightly from July through early September (0.60 to 0.94 mg L-1). This typical pattern is shown in Figure 6 as nitrate concentration at site R10 over time. This increase was more evident near the dam than at the upstream end of the reservoir. Levels dropped substantially at all sites in late September to a nearly uniform concentration throughout the lake (0.50 to 0.58 mg L-1). This was slightly lower than levels observed at the beginning of sampling. Nitrate patterns observed during the time of this study period correlated more strongly with time than with distance from the dam. A nitrate concentration, mg/L B concentration, mg/L nitrate concentration, mg/L RIVER (R22) 25-Jul C 1-Aug DAM (R1) 14-Aug 6-Sept 29-Sept 4-Nov nitrate concentration, mg/L FIGURE 5: A 3-D plot of nitrate concentrations demonstrates the linear pattern observed at the beginning of the sampling season as well as the temporal pattern that was observed nitrate concentration, mg/L FIGURE 7: A and B show the linear spatial pattern observed during the summer; C shows nitrate concentrations in late fall after the pattern had disappeared FIGURE 6: Concentrations at Site R10 show the general temporal pattern of increasing nitrate through summer followed by a substantial drop in the fall A Total Phosphate- Total phosphate averaged 0.18 mg L-1 for the entire sampling period. The graph in Figure 8 shows the temporal and spatial changes we observed. We discovered the highest concentrations in July (0.38 mg L-1). A statistically insignificant increase in total phosphate occurred from August through September (0.13 to 0.29 mg L-1). A sharp decrease at all sites to extremely low values (0.01 to 0.04 mg L-1) occurred at the beginning of November prior to fall turnover. The general temporal pattern that occurred at the majority of the sites is illustrated by site R10 in Figure 9. Phosphate concentrations varied through time but did not vary with location. See Figure 10. B phosphate concentration, mg/L phosphate concentration, mg/L phosphate concentration, mg/L FIGURE 9: Concentrations of total phosphate at Site R10show an overall decrease over the sampling season FIGURE 10: Total phosphate concentrations did not vary with distance from the dam, but did exhibit a dramatic decrease over summer and fall
DISCUSSION A prior study conducted on Raystown Lake by Simpson in 1998 investigated oxygen depletion in the metalimnion. She identified a plume-like pattern developing from the upstream end of the reservoir and enlarging downstream as summer progressed. Simpson determined that the plume was largely a result of biotic growth in the lake due to the influx of water from the river and was not a function of recreational activity, which was one of the tested hypotheses. A clear influence on these oxygen-consuming organisms is the availability of essential nutrients. Simpson’s study did not include an investigation of nutrient levels in a manner that can be correlated to biotic growth patterns throughout the season. This study, though beginning at a time later than desired, attempted to characterize nutrient availability and loading in the lake. The Raystown Branch of the Juniata River is the main input stream into Raystown Lake. It drains a largely agricultural area in the adjacent Morrison’s Cove. We predicted that this input would be a significant contributor of nutrients and one of the governing factors in oxygen related biological activity in the lake. Therefore, we thought it would be valuable to document spatial and temporal distribution of nutrients in the lake. James Creek, which also drains a largely agricultural area, was considered another potential source of influence near mid-lake. Transparency- Seechi disc transparencies reported in this investigation were nearly identical to values from past studies. The definite trend of increasing transparency downstream is due to sedimentation of suspended materials carried into the lake from the river and elevated nutrient levels resulting in a higher density of plankton in the epilimnion. The pattern we observed was probably caused by a combination of sedimentation and increased biotic activity. Behavior of nitrate- A post-impoundment survey from 1974 to 1976 reported average lake-wide values of nitrate ranging from 0.75 to 0.84 mg L-1 with a noted pattern of increasing concentrations towards the river input. Total range observed in this study was 0.32 to 1.50 mg L-1. Seasonal fluctuations showed a consistent pattern of highest values in March and lowest values in August/September with a gradual change in the times between (Williams 1978). Studies conducted by the Army Corps of Engineers between 1994 and 1998 reported average epilimnetic nitrate values of 1.00 to 1.20 mg L-1. A weak geographic pattern was observed with increasing values towards the main river input and a possible nitrate source near mid-lake. No seasonal trend was detected (Kulp 2000, personal correspondence). A one day nitrate testing of the lake conducted in June 1998 reported values of 0.3 to 1.1 mg L-1 with a strong trend of increasing nitrate concentrations toward the river input (Simpson 1998, unpublished data). Our study reported values in a similar range as these previous studies (0.47 to 1.00 mg L-1), but introduced a more complex seasonal trend that had remained undetected prior to this study due to sampling frequency. This indicates the importance of replication and more frequent and extended sampling in order to characterize nutrient loading occurring in Raystown Lake. We observed a geographic pattern of lower nitrate concentrations near the dam and higher concentrations near the river input that was noted in the study conducted by Simpson. This was evident in the July 25 sampling (Figure 7B). This trend faded over the end of summer and early fall and was no longer present by September 6. By September 29, nitrate values at all sites fell to a rather uniform value that was lower than values observed at the beginning of the sampling (Figure 5). The spatial distribution of nitrate values suggests that the major source of nitrate into this system is the Raystown Branch of the Juniata River. This conclusion is consistent with the observation that this sub-basin is the largest and most agricultural in the Raystown watershed (Figure 2). Another source suggested by spatial trends is James Creek, which enters Raystown Lake near mid-lake, but evidence for this is not clear. Elevated values during the summer in the upper end of the reservoir may be a reflection of high seasonal inputs of nitrate from agricultural sources. Increased nitrate use from commercial fertilizers and the spreading of accumulated manure before or shortly after planting could lead to these values. Higher amounts of rain and rates of runoff in spring and early summer could also contribute to these increases. Lake-wide averages showed a modest increase over the period from late July through September (Figure 6). This appears to reflect a build-up of unutilized nitrate through this time period as values of available reactive phosphate were decreasing. Another possible cause of this apparent increase in nitrate concentrations can be explained through migration of the original input nutrients downstream. Knowing the hydraulic residence time in the lake is 233 days, it would take approximately 16 weeks to travel half the distance of the lake. This increase may also be influenced by seasonal contributions to the lake from groundwater draining highly agricultural land. However, because exact groundwater inputs are unidentified and not characterized in terms of volume and chemistry at this time, we cannot determine how much of an influence groundwater could have, if any. The dramatic and rather sudden decrease in nitrate concentrations experienced in late September was not anticipated. There was no spatial pattern to this event, and the final levels were lower than what had been reported at the beginning of the sampling season. In order to explain this event, it may be necessary to examine the biological interactions between organisms in the epilimnetic waters and elements essential for life, such as carbon, oxygen, phosphorus, and nitrogen. Behavior of total phosphate- Studies conducted prior to this investigation recorded reactive phosphate concentrations ranging from 0.03 to 0.08 mg L-1. There was no clear temporal trend but a vague spatial trend suggested a phosphate input near mid-lake (Kulp 2000). Average lake-wide values obtained from the post-impoundment survey range from 0.00 to 0.04 mg L-1 orthophosphate, or reactive phosphate. This study also investigated total phosphorus, which averaged 0.01 to 0.02 mg L-1 (equivalent to 0.03 to 0.06 mg L-1 total phosphate) and included a total range from 0.00 to 0.07 mg L-1 (equivalent to 0.21 mg L-1 total phosphate). A pattern of increasing concentrations towards the river input was noted in both orthophosphate and total phosphorus. In both cases, values obtained from near the river input were lowest in September/October 1974 and in November 1975. Both years show peaks in March, and total phosphorus produced a second peak in September 1975 (Williams 1978). Information obtained in previous studies led us to the conclusion that phosphorus must be the limiting nutrient in Raystown Lake. This agrees with behavior common in many natural systems. We presumed that there would not be detectable amounts of reactive phosphate remaining in the water and therefore, this information would not be useful in attempting to characterize nutrient trends. Testing for total phosphate would reflect available phosphate as well as the accumulation of phosphate in microorganisms that remain suspended in the water column. The decision to analyze the water for total phosphate rather than reactive phosphate was made on this basis. Values we obtained in this study were dramatically higher than those reported in 1978. This may be reflective of a lack of planktonic organisms shortly following the creation of the reservoir. This indicates that there is nutrient loading taking place in Raystown Lake that is likely to become an issue of concern in the future. We found no geographic pattern in total phosphate concentrations (Figure 10A). We did find a trend suggestive of an overall seasonal pattern of decreasing concentrations (Figure 9). This decrease in total phosphate probably reflects consumption of the epilimnetic phosphate by algae and other planktonic organisms as the summer progresses. It may also be indicative of the loss of phosphorus as it settles out of suspension to the underlying sediments. Data from a preliminary investigation conducted in midsummer (July 13) not included in this sampling set produced values of 0.90 to 1.08 mg L-1, supporting this interpretation. This data was not included in this study due to different sampling depths and locations. These high values were observed during the warmest months of the summer when productivity was probably at a high. By the following sampling (July 25), concentrations had dropped significantly to 0.33 to 0.52 mg L-1. We surmise that this drop may be a delayed effect of spring bloom. By fall (November 4), total phosphate was nearly undetectable (Figure 10B). It is important to note that we have not constrained these conclusions very well. We do not have discharge data for the tributaries to the lake nor do we know what influence springs in the area might have on the water chemistry. Adjacent topographic relief and variations in the hydraulic characteristics of the exposed easterly-dipping sedimentary rocks have the potential to produce flows from undefined sources below lake level, adding an additional factor in nutrient patterns. This study also did not investigate in detail biological cycles that may have a substantial impact on nutrient concentrations. FURTHER INVESTIGATION This study provides an in depth view of nutrient concentrations and patterns in the lake and offers a possible explanation for our observations. A further, more extensive investigation would be necessary in order to more precisely classify the water quality of Raystown Lake in terms of nutrient concentrations and related productivity. This would be useful to understand the causes of nutrient behavior as well as exact sources of phosphate and nitrate. A very important addition to this study would be to begin sampling much earlier in the year, perhaps April. This would provide a more complete description of nutrient behavior and enable better correlation to the time of year and suggested inputs. When analyzing samples, filtering should be considered. This could eliminate microfauna captured in the sample that may alter the actual nutrient concentrations. Focus on vertical patterns is another possibility. Such patterns have been noted in literature and by other studies on Raystown Lake and are an important characteristic in determining degree of eutrophication of lakes. Monitoring rainfall and springs in the area would allow us to determine associated dilution or concentration effects upon nutrients. Chemical discharge data for major inputs to the lake, both surface and subsurface, would be another valuable addition. This would enable better identification of sources of nutrient input. REFERENCES 1. 1989, HACH Water Analysis Handbook 2nd Edition, Loveland, Colorado: Hach Company, p. 400-401, 523-545. 2. Army Corps of Engineers, 2001, Raystown Lake Pennsylvania, <www.nab.usace.army.mil> 2000, September 19. 3. Kulp, Kenneth P., 2000, Water Quality of Raystown Lake, Army Corps of Engineers, Unpublished data. 4. Metcalf, Alexander, 2001, Unpublished data.5. Simpson, Sharon, 1998, Unpublished data. 6. Wetzel, Robert G., 1975, Limnology: Pennsylvania, W.B. Saunders Company, 743 p.7. Williams, Donald R., 1978, Postimpoundment Survey of Water- Quality Characteristics of Raystown Lake, Huntingdon and Bedford Counties, Pennsylvania: United States Geological Survey Water Investigation 78-42, 53 p.