Download
1 / 11
110 likes | 228 Views
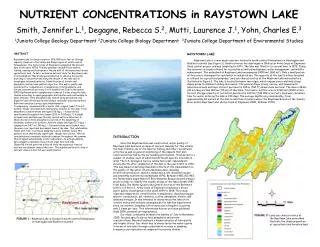
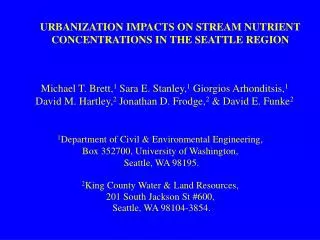
URBANIZATION IMPACTS ON STREAM NUTRIENT CONCENTRATIONS IN THE SEATTLE REGION. Michael T. Brett, 1 Sara E. Stanley, 1 Giorgios Arhonditsis, 1 David M. Hartley, 2 Jonathan D. Frodge, 2 & David E. Funke 2. 1 Department of Civil & Environmental Engineering,

E N D
URBANIZATION IMPACTS ON STREAM NUTRIENT CONCENTRATIONS IN THE SEATTLE REGION Michael T. Brett,1 Sara E. Stanley,1 Giorgios Arhonditsis,1 David M. Hartley,2 Jonathan D. Frodge,2 & David E. Funke2 1Department of Civil & Environmental Engineering, Box 352700, University of Washington, Seattle, WA 98195. 2King County Water & Land Resources, 201 South Jackson St #600, Seattle, WA 98104-3854.
King County Data • 10 years, 17 streams, sampled monthly • Non-storm and storm samples • 7 variables analyzed
Land Cover Versus Stream Nutrients: Normal Flows Total Phosphorus Nitrate Turbidity 6 100 1500 2 2 2 r = 0.33 r = 0.16 r = 0.58 5 1250 (µg/l) 80 Tibbets 4 1000 3 60 Geomean TP (µg/l) 3 750 Geomean turbidity (NTUs) 40 Geomean NO 2 500 20 1 250 0 0 0 0% 20% 40% 60% 80% 100% 0% 20% 40% 60% 80% 100% 0% 20% 40% 60% 80% 100% Percent Urban Land Cover Percent Urban Land Cover Percent Urban Land Cover Soluble Reactive Phosphorus Ammonium Total suspended solids 50 10 2 50 2 2 r = 0.56 r = 0.36 r = 0.03 40 8 Tibbets (µg/l) 40 4 30 6 30 Geomean SRP (µg/l) Geomean TSS (mg/l) 20 4 20 Geomean NH 10 2 10 0 0 0 0% 20% 40% 60% 80% 100% 0% 20% 40% 60% 80% 100% 0% 20% 40% 60% 80% 100% Percent Urban Land Cover Percent Urban Land Cover Percent Urban Land Cover
Change in Concentration: Storm/Normal Flow Total Phosphorus Nitrate Turbidity 2.0 8 3.0 2 2 2 r = 0.67 r = 0.11 r = 0.03 Coal 2.5 Coal 1.6 6 184 ± 83% 2.0 1.2 (Storm/Normal Flow) 4 1.5 TP (Storm/Normal Flow) Turbidity (Storm/Normal Flow) 0.8 1.0 2 0.4 55 ± 45% 0.5 3 NO 0.0 0 0.0 0% 20% 40% 60% 80% 100% 0% 20% 40% 60% 80% 100% 0% 20% 40% 60% 80% 100% Percent Urban Land Cover Precent Urban Land Cover Percent Urban Land Cover Ammonium Soluble Reactive Phosphorus Total Suspended Solids 1.6 2.5 14 2 2 2 r = 0.51 r = 0.18 r = 0.09 12 Coal 2.0 1.2 10 244 ± 116% 1.5 8 (Storm/Normal Flow) 0.8 SRP (Storm/Normal Flow) TSS (Storm/Normal Flow) 6 1.0 4 0.4 0.5 67 ± 36% 4 2 NH 0.0 0.0 0 0% 20% 40% 60% 80% 100% 0% 20% 40% 60% 80% 100% 0% 20% 40% 60% 80% 100% Percent Urban Land Cover Percent Urban Land Cover Percent Urban Land Cover
Total & Soluble Reactive Phosphorus TSS and Turbidity Nitrate & Ammonium 2.0 2.0 2.0 TP SRP seasonal mean/yearly mean seasonal mean/yearly mean seasonal mean/yearly mean 1.0 1.0 1.0 NO 3 TSS NH 4 Turbidity 0.5 0.5 0.5 Fall Fall Fall Winter Winter Winter Spring Spring Spring Summer Summer Summer Summer Summer Summer Seasonal Fluctuations in Stream Constituent Concentrations
Average Average Percent Units Constituent Forested Urban Enrichment Total Phosphorus µg/l 32.3 67.8 109% Soluble Reactive P µg/l 13.1 33.4 154% Total Nitrogen µg/l 1065 1412 33% Nitrate µg/l 840 1088 29% Ammonium µg/l 13.7 24.8 81% Turbidity NTUs 1.71 3.01 77% Total Susp. Solids mg/l 4.33 5.90 36% Percent Urban Enrichment
Seattle streams Omernik (1976) Seattle For./ Seattle Urban/ Constituent Forested Urban Forested Agri. Omernik's For. Omernik's Ag. Total Phosphorus 32 70 35 135 0.92 0.52 Soluble Reactive Phosphorus 13 35 14 58 0.94 0.61 Total Nitrogen 1065 1404 885 4170 1.20 0.34 Dissolved Inorganic Nitrogen 862 1107 347 3190 2.48 0.35 Agricultural vs. Urban Enrichment
Averaged Overall Change in Urban Stream SRP Concentrations Urban stream SRP concentrations Urban stream nitrate concentrations 60 1300 y = -0.86x + 1747 y = -9x + 18950 2 2 r = 0.42 r = 0.31 55 1200 50 1100 45 Mean Annual SRP conc. (µg/l) Mean annual nitrate conc. (µg/l) 1000 40 35 900 30 800 25 1980 1985 1990 1995 2000 1980 1985 1990 1995 2000
Conclusions: • Urban streams are enriched with Phosphorus by about 100-150% and with Nitrogen by about 30-70%. • Stream TSS concentrations and Turbidity are more closely related to short term flow fluctuations than to land cover. • Forested streams export inorganic nitrogen and phosphorus during storms. • Stream phosphorus concentrations peak during the summer, and nitrogen and sediment concentrations peak during the winter. • The most urbanized streams have had a 36% decline in SRP and a 15% decline in nitrate concentrations during the last 20 years.
2.0 A rithmetic Log 10 1.5 Signal/Noise 1.0 0.5 0.0 TP SRP NO3 NH4 Turbid TSS Constituent