Nutrient Runoff Effects on Jordan Lake
270 likes | 418 Views
Nutrient Runoff Effects on Jordan Lake. Brianna Young, Jennifer Jackson and Emily Nurminen. Jordan Lake Stats. Man-made reservoir initially created as a flood control Now serves as a water source for many surrounding cities such as: Durham, Cary, Apex, Morrisville, RTP, and Chatham County

Nutrient Runoff Effects on Jordan Lake
E N D
Presentation Transcript
Nutrient Runoff Effects on Jordan Lake Brianna Young, Jennifer Jackson and Emily Nurminen
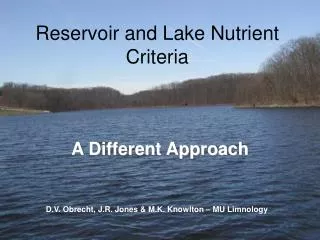
Jordan Lake Stats • Man-made reservoir initially created as a flood control • Now serves as a water source for many surrounding cities such as: Durham, Cary, Apex, Morrisville, RTP, and Chatham County • Is located within the New Hope and Haw River watersheds
Jordan Lake Stats • Project started in 1945 and was finally flooded in 1983 • Surface area: 13,940 acres (56.4 km2) • Primary source: Haw River • Standard elevation: 216 ft (66m) above sea level
Water Problems • J. reservoir has had very nutrient rich waters since the time of its impoundment • Excessive algal growth • Reservoir has been designated as “impaired” • 1983- NC Envt’l Management Commission designate J. Lake as “Nutrient Sensitive Water” (NSW)
Jordan Lake Rules! • June, 2007- New rules for future construction – these were the strictest rules for watersheds in NC’s history • Major Rules: 1.)reduce annual average N and P loads to the lake from all sources 2.)J. Lake is divided into 3 arms (2 New Hopes and Haw River) 3.)each arm of lake will meet its respective nutrient requirements
Why Do We Give a Hoot? • Important water source • Build-out increasing • Effects of build-out on nutrient loading • Effects of moving build-out further upstream • J. Lake is NSW • Increasing dependence on J. Lake • Diverse wildlife
The Legacy • Construction began 2006 • Located along the western shore of J. Lake within the New Hope Basin • Residential community with total of 436 lots covering 628 acres (including golf course) • 3 phases of construction
Phase I • 3 sub-phases: • Legacy Falls (26 lots) • Legacy Hills (34 lots) • Legacy Park (43 lots) • Total: 105 lots, 238 acres
Phase II & III • Phase II • Avg lot size: 23, 681 ft2 • 82.52 acres • 54 lots • Phase III • Avg lot size: 25,633 ft2 • 83.01 acres • 60 lots
GIS Aspect We used GIS to extract the watershed basin we were going to focus on so that we could obtain the NLCD landcover data for the catchments the development was going to be in.
The Process • Clipped Haw River and New Hope watersheds from a file containing the entire water network for the Southeast U.S. • Overlaid NHD water body to locate Jordan Lake • Overlaid files for primary, secondary, and local roads to get an exact location • Overlaid catchment data • Added NHD flowline attributes data table • Overlaid NED file for the area to view the elevation of catchments
The Process • Joined catchment shapefile with NLCD flowline attributes to get CUMNLCD • Used identify function to select catchment of interest and obtain information about landcover • Compiled data to get total values
NLCD Classifications 11 Open Water 12 Perennial Ice/Snow 21 Developed, Open Space 22 Developed, Low Density 23 Developed, Medium Density 31 Bare Rock/Sand/Clay 32 Quarries/Strip Mines/Gravel Pits 33 Transitional 41 Deciduous Forest 42 Evergreen Forest 43 Mixed Forest 51 Shrub 61 Orchards/Vineyards/Other 71 Grassland/Herbaceous 81 Pasture/Hay 82 Row Crops 83 Small Grains 84 Fallow 85 Urban/Recreational Grasses 91 Woody Wetlands 92 Emergent Herbaceous Wetlands
What’s In Store? How will the nutrient runoff rates be affected if we move the development farther upstream?