Tax Progression: International & Intertemporal Comparisons Using LIS Data
600 likes | 694 Views
Explore tax progression through international and intertemporal comparisons. Local, global, and uniform measures illustrated with real-world applications. Understanding tax progression methods and implications for various income distributions.

Tax Progression: International & Intertemporal Comparisons Using LIS Data
E N D
Presentation Transcript
TAX PROGRESSION: INTERNATIONAL & INTERTEMPORAL COMPARISONS USING LIS DATA Kirill Pogorelskiy, SU-HSE, Moscow, Russia Christian Seidl, University of Kiel, Germany Stefan Traub, University of Bremen, Germany July 24, 2010 X International Meeting of the Society for Social Choice and Welfare Moscow
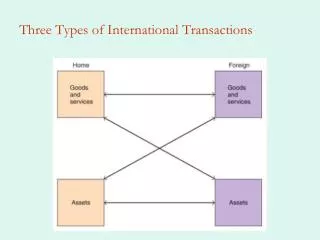
Methodology • Conventional approach: use measures of tax progression to make comparisons • Local, global, uniform with identical income distributions • Lacks applicability to real world • Situations to be compared have different income distributions • Local measures, e.g., tax and residual elasticities, disregard income distribution (only use the properties of the tax schedule) • Suits (1977), p. 725: “There is nothing inherently regressive about a sales tax or even a poll tax. They are regressive because income is unequally distributed, and the more unequally income is distributed, the more regressive they become.” • Global measures, e.g., based on Gini coefficients, ignore structural differences in the objects being compared • They can compensate intervals with less progression or even regression with intervals with high progression. • Uniform measures, e.g., first-moment distribution functions of taxes or net incomes, use dominance relations of the respective curves and require identical income distributions (equal supports) to hold in both situations • Second, uniform measures establish just sufficient conditions of greater tax progression if considered not for all possible income distributions, but for particular ones being compared • Both taxes in this figure would be classified as proportional taxes. • Familiar problem with any sort of average
Uniform measures of tax progression for identical income distributions • Let us start with the first moment functions • These functions indicate the share of Total Income /Tax Revenue/ Net Income received (or paid) by the income recipients with gross incomes less or equal to Y • Varying Y from the lowest income level Y* to the highest income Y*, comparing tax progression comparing the concentration curves • (1)-(3) are not suitable if the income distributions in the situations to be compared have different supports, because in such case 100% of TI1 / TR1 / NI1 is not equal to 100% of TI2 /TR2 / NI2 (1) (2) (3)
Uniform measures of tax progression for different income distributions… • Several ways to cope with this situation • Transplant and compare: remaining in the domain of incomes, deform the income distribution of 1st situation to the distribution of the 2nd; then subject both to the taxation of the 2nd (and vice versa, Dardanoni and Lambert, 2002). • Independence of the baseline distribution holds iff the candidate reference income distributions are isoelastic transformations of one another, which hardly ever occurs in the real world. • Approach from Seidl (1994): transform the income domain into the domain of population quantilesq or income quantilesp → the range of both dominance curves is the same unit interval. • Hence, we compare the same population or income quantiles in different countries/ time periods with respect to taxes/net incomes. • Formally, apply the transformations of variables Y=F-1(q) and to(1)-(3)
Uniform measures of tax progression for different income distributions FY(q) [FT(q), FY-T(q)]: Lorenz curve(s) of gross income /tax schedule /net incomes; share of total GI / TR / NI received/paid by the fraction q of the poorest taxpayers , : Suits (1977) curve(s) of taxes and net incomes; share of total TR/NI paid/received by the poorest taxpayers whose compound GI is the fraction p of total GI Note that we have for any progressive tax schedule if 0<q=p<1, because the fraction q of the poorest taxpayers holds only a fraction of total gross income, FY(q), which is smaller than Moreover, for co-monotonic GI,T,NI and progressive tax schedules we have:
Definitions of greater tax progression • A tax schedule T1 is uniformly more progressive than T2 whenever the concentration curve of FT1 relative to FT2 does not cross the diagonal of the unit square except at the endpoints (0,0) and (1,1). • This means that for the same fractions q or p as applied to the two income distributions, T1 collects a smaller fraction of aggregate taxes from smaller incomes than does T2. • A sufficient condition for the concentration curve of FT1 relative to FT2 to lie wholly below the diagonal of the unit square is that it is strictly convex. • Uniformly greater tax progression can also be defined in terms of second-order differences of first moment distribution functions. • E.g., T1 is uniformly more progressive than T2 whenever FY1-FT1 > FY2-FT2 holds for the whole support. • This means that the difference between the first moment distribution curves, which is due to the influence of taxation, is greater for the situation (Y1,T1) than for the situation (Y2,T2). The corresponding condition in terms of net incomes can be written as FY1-T1-FY1 > FY2-T2 – FY2 .
Uniform tax progression for different income distributions: the challenge • This approach reveals not only dominance relations of tax progression, but also the structure of tax progression • Unique curve intersections (bifurcate progression) show that less progression for one country or time period for the lower income strata is accompanied by more progression for the upper income strata and vice versa. • But do we end up with sufficiently many clear-cut solutions? • Atkinson (1970), p. 258, asserted that for comparisons among 12 countries “in only 24% of cases the Lorenz curves of incomes do not intersect”. • Yet Bishop et al. (1991), p. 462, found statistically significant intersections of Lorenz curves only in 3% of all cases, whereas 97% of the Lorenz curves were ranked; • In contrast to that, simple numerical comparisons would have ranked as much as about 75% of the comparisons of Lorenz curves • After all, this works out to become an empirical exercise. • First, one has to transform definitions into a discrete framework.
Uniform Tax Progression for Different Income Distributions: Discrete Version
(Empirical) Questions • Do we have a substantial fraction of dominance relations for comparisons of tax progression, or dominance is the exception rather than the rule? What kind of dominance curves do we usually observe? • What happens when dominance relations do not hold? Do we mainly encounter bifurcate or some other progression patterns? • What is the relative performance of the 6 methods we use to compare tax progression? Are there interrelationships? • What classifications can result from international/intertemporal comparisons of tax progression? • How can we measure the degree of greater tax progression? • Are there relations between changes in tax progression over time and changes in the ruling parties and their ideologies? • How sensitive are our results to equivalence scale parameter?
Data… • Luxembourg Income Study (LIS) www.lisproject.org • Detailed, real, harmonized, standardized, representative microdata; not second-hand data simulations • Both household-based and individual-based • Information required • Gross Incomes, Net Incomes, Direct Taxes, Payroll Taxes • NI1=GI-DT; or NI2=GI-(DT+PT) • Countries we studied (total 13) • Australia, Canada, Denmark, Germany, Finland, France, Netherlands, Norway, Poland, Sweden, Switzerland, United Kingdom, United States • International comparisons • around year 2000, as maximizing the # of available country data • Intertemporal comparisons • at least 3recent survey periods (waves III - VI, if data allowed) • This is the first paper that performs international and intertemporal comparisons of uniform tax progression with actual data.
Data • Direct data access is not permitted by LIS • To access the LIS data, we wrote a program in SPSS that computed and returned the values of FY(q), FT(q), etc., for 20 equally-spaced quantiles. • This allowed us to carry out the remaining related computations off-line, which is much faster and easier • We used a Visual Basic macro to facilitate processing of the LIS output. • We used 5% steps (i.e., 20 quantiles) because: • Thereby we avoid data noise for too narrow quantiles • This is a rather fine grid as compared to other work. E.g., Sala-i-Martin (2006) worked with quintiles. Bishop et al. (1991) worked with deciles for constructing Lorenz curves, arguing that “increasing the number of quantiles does not necessarily improve the quality of the overall test” . • We used household and equivalized data both for direct taxes only and for direct taxes + payroll taxes. • Hence we analyzed four datasets: HT, HT+, ET, ET+ • Furthermore, we carried out computations for all six definitions.
Results: International Comparisons – Dominance I Summary statistics: household data; taxes Summary statistics: household data; taxes + payroll
Results: International Comparisons – Dominance I Summary statistics: equivalized data; taxes Summary statistics: equivalized data; taxes + payroll
Results: International Comparisons – Consistency I Consistency for Strict Dominance 46.15 47.44 43.59 42.31 Consistency for Bifurcate Dominance 71.79 67.94 67.96 61.54
Results: International Comparisons – Consistency II • The table below contains rough indications of similarities and dissimilarities among the progression comparison concepts • It is based on pairwise comparisons of the entries in Tables 2 to 7 (which report the results corresponding to Definitions 1-6; see Handouts) counting the dominance and bifurcate relationships that are identical between pairs of tables • The first entries in the cells of this table contain the percentages (as averages of all four datasets) of congruence of the respective D’s and R’s in the cells of the pairs of the compared tables, the second entries contain the percentages (as averages of all four datasets) of cases in which a D or R is not matched by the respective symbol in the other table. • Multiple crossings were ignored. • Definition 3 is at variance with the other concepts.
Results: International Comparisons – Categorical Data I • Each cell in Tables 2 -7 contains 4 entries: those in the 1st row refer to household data, those in the 2nd row to equivalized data using the Luxembourg equivalence scale m- with = 0.5. • The left-hand side entries in a cell refer to direct taxes only, while the right-hand side entries to direct taxes + payroll taxes. • Only few left-hand side and right-hand side columns of Tables 2 -7 differ within each cell. Basically the same observation applies to the rows within each cell. • This means that comparative progression is not changed much if we extend the direct taxes by payroll taxes. • This is remarkable since payroll taxes (which consist mainly of employees’ share of social security contributions) are by and large proportional to income for the lower and middle income strata, but they expire for incomes beyond some benchmark. Moreover, for the lower income strata they are usually considerably higher than the direct taxes => they have a regressive effect on overall tax progression. • The tables also show that high tax countries, e.g., Germany, medium tax countries, e.g., France, and low tax countries, e.g., the US are classified as more progressive than most other countries. • This is because the measures in this paper are developed to compare uniform tax progression, not the level of taxation. • Sweden and Denmark have taxes that reach a high percentage of income rather fast and remain there, which is more akin to proportional taxation; the same pattern applies to the UK for a medium tax burden, and to Switzerland for a low tax burden. In contrast to that, the income interval for which taxation is steadily increasing as a percentage of income is comparatively extensive in Germany, France, and the US. This explains their dominance with respect to comparisons of tax progression. For similar results using another approach see Peichl & Schäfer (2008).
Results: International Comparisons – Categorical Data II • The next few slides show Hasse diagrams of progression dominance for our 4 data sets for all 6 definitions of greater tax progression. • These are precisely the entries with a D in Tables 2-7. • Note that these diagrams concern only categorical relationships. • Information about the intensity of progression can be gained from the differences of the respective curves (will be shown in the graphs below) • Finally, we will present graphs showing the effect of different parameter values of equivalence scales.
Uniform Tax Progression for Different Income Distributions: International Comparisons – UK/US Def. 1: US m.p. than UK Def. 2: US m.p. than UK Def. 3: first UK, then US Def. 4: US m.p. than UK Def. 5: US m.p. than UK Def. 6: US m.p. than UK Def. 1: US m.p. than UK Def. 2: US m.p. than UK Def. 3: first UK, then US Def. 4: US m.p. than UK Def. 5: US m.p. than UK Def. 6: US m.p. than UK
Uniform Tax Progression for Different Income Distributions: International Comparisons – UK/US Def. 1: US m.p. than UK Def. 2: US m.p. than UK Def. 3: US m.p. than UK Def. 4: US m.p. than UK Def. 5: US m.p. than UK Def. 6: US m.p. than UK Except for Definition 3, US is uniformly more progressive than UK. For Definition 3 we have for household data first UK, then US. Def. 1: US m.p. than UK Def. 2: US m.p. than UK Def. 3: US m.p. than UK Def. 4: US m.p. than UK Def. 5: US m.p. than UK Def. 6: US m.p. than UK
Uniform Tax Progression for Different Income Distributions: Intertemporal Comparisons - US The characterization of periods to be compared by the respective governments should not impart the impression of strict causality. Progression effects are also due to shifts in household structure, income distribution, shifts in individuals’ behavior, etc. The association to the governments should just provide a label for the periods to be compared.
Uniform Tax Progression for Different Income Distributions: Intertemporal Comparisons - US Def. 1: US94 m.p. than US91 Def. 2: US94 m.p. than US91 Def. 3: US91 m.p. than US94 Def. 4: US94 m.p. than US91 Def. 5: first US91, then US94 Def. 6: US94 slightly m.p. than US91 Def. 1: US94 m.p. than US91 Def. 2: US94 m.p. than US91 Def. 3: US91 m.p. than US94 Def. 4: US94 m.p. than US91 Def. 5: first US91, then US94 Def. 6: US94 slightly m.p. than US91
Uniform Tax Progression for Different Income Distributions: Intertemporal Comparisons - US Def. 1: US94 m.p. than US91 Def. 2: US94 m.p. than US91 Def. 3: US91 m.p. than US94 Def. 4: US94 m.p. than US91 Def. 5: first US91, then US94 Def. 6: US94 slightly m.p. than US91 The same pattern for all four graphs! Def. 1: US94 m.p. than US91 Def. 2: US94 m.p. than US91 Def. 3: US91 m.p. than US94 Def. 4: US94 m.p. than US91 Def. 5: first US91, then US94 Def. 6: US94 slightly m.p. than US91
Uniform Tax Progression for Different Income Distributions: Intertemporal Comparisons - US Def. 1: first US94, then US00 Def. 2: US94>US00>US94 Def. 3: first US00, then US94 Def. 4: first US00, then US94 Def. 5: US94>US00>US94 Def. 6: US00 m.p. than US94 Def. 1: first US94, then US00 Def. 2: US94>US00>US94 Def. 3: first US00, then US94 Def. 4: first US00, then US94 Def. 5: US94>US00>US94 Def. 6: US00 m.p. than US94
Uniform Tax Progression for Different Income Distributions: Intertemporal Comparisons - US Def. 1: first US94, then US00 Def. 2: US94>US00>US94 Def. 3: first US00, then US94 Def. 4: first US00, then US94 Def. 5: first US00, then US94 Def. 6: US00 m.p. than US94 For Definition 5, H: US94>US00>US94 for E: first US00, then US94. Everything else the same. Def. 1: first US94, then US00 Def. 2: US94>US00>US94 Def. 3: first US00, then US94 Def. 4: first US00, then US94 Def. 5: first US00, then US94 Def. 6: US00 m.p. than US94
Uniform Tax Progression for Different Income Distributions: Intertemporal Comparisons - US Def. 1: US04 m. p. than US00 Def. 2: US04 m.p. than US00 (exc. T/B) Def. 3: US00 m.p. than US04 Def. 4: US00 m.p. than US04 Def. 5: first US00, then US04 Def. 6: US00 m.p. than US04 Def. 1: US04 m. p. than US00 Def. 2: US04 m.p. than US00 Def. 3: US00 m.p. than US04 Def. 4: US00 m.p. than US04 Def. 5: US00 largely m.p. than US04 Def. 6: US00 m.p. than US04
Uniform Tax Progression for Different Income Distributions: Intertemporal Comparisons - US Def. 1: first US04 , then US00 Def. 2: first US04, then US00 Def. 3: first US00 , then US04 Def. 4: US00 m.p. than US04 Def. 5: first US00, then US04 Def. 6: US00 m.p. than US04 More progression for HT [HT+] becomes bifurcate progression for ET [ET+] for Definitions 1, 2, and 3 [1 and 3 ] [effect of transforming data by equivalence scales]. Bifurcate progression for HT and ET for Definition 5 becomes progression for HT+ and ET+; bifurcate progression for ET for Definition 2 becomes progression for ET+ [effect ofpayroll taxes]. . Def. 1: first US04 , then US00 Def. 2: US00 m.p. than US04 Def. 3: first US00 , then US04 Def. 4: US00 m.p. than US04 Def. 5: US00 m.p. than US04 Def. 6: US00 m.p. than US04
Uniform Tax Progression for Different Income Distributions: Equivalence Scales Equivalence Scales Matter! It is interesting to see that equivalence scales matter very much for some definitions. It is in particular Definitions 1 and 3 which are extremely sensitive to equivalence scales. They can account for up to 8% of progression comparisons. Definition 1: As the parameter αof the LIS equivalence scale, m-α, decreases, tax progression according to Definition 1 increases. Definition 2: As αincreases, tax progression according to Definition 2 increases, but much less than for Definition 1. This is much less distinctive than for Definition 1, and is hardly seen for US data. Definition 3: As αincreases, tax progression according to Definition 3 increases. Definition 5: As αincreases, tax progression according to Definition 5 increases for the lower income strata and decreases for the upper income strata (bifurcate progression). There are no major effects of equivalence scales for Definitions 4 and 6.
Uniform Tax Progression for Different Income Distributions: Equivalence Scales- US
Conclusions… In the conclusion of this paper we come back to the issues to be investigated: • Do we have a substantial fraction of dominance relations for comparisons of tax progression, or is dominance the exception rather than the rule? We have about two thirds of strict progression dominance relations and one fifth of bifurcate progression dominance. Only in about one tenth do we encounter multiple crossings. Statistically significant crossings are even less. What kind of dominance curves do we usually observe? For household data, about three quarters of the cases of progression dominance conforms with strict convexity or concavity; for equivalized data, it is about two thirds. • What happens when dominance relations do not hold? Do we mainly encounter bifurcate or some other progression patterns? Bifurcate progression holds in about three thirds of these cases; only in about one third (10% of all cases) do we encounter multiple crossings; some of them are so weak that they may well be ignored. • What is the relative performance of the six proposed measures of the comparison of tax progression? Are there interrelationships? We have remarkable congruence among Definitions 1,2, 4. and 5. It is, in particular, Definition 3 which marches to a different drummer. • What classifications can result from international/intertemporal comparisons of tax progression? Countries with high taxation levels such as the Scandinavian countries tend to have lower tax progression. Low-tax countries like the US and medium-tax countries like Germany have high progression. UK has lower progression than both. Payroll taxes tend to lower tax progression; however, this effect is not very pronounced.
Conclusions • How can we measure the degree of greater tax progression? Can be seen from the graphs (but note that they are differently calibrated). Definitions 5 and 6 tend to show least intensity of progression. • Are there relations between changes in tax progression over time and changes in the ruling parties and their ideologies? In the US, there has been slight increase in progression from Bush sen. to Clinton; not much change during the Clinton government, and less progression under Bush jun. In the UK there was less progression from Major to Blair. In Germany, progression increased from 1989 to 2000. • How sensitive are our results to equivalence scale parameter? Equivalence scales matter much for Definitions 1 and 3 in opposite ways, and less for Definitions 2 and 5.
References • Atkinson, AB 1970, ‘On the measurement of inequality’, Journal of Economic Theory, vol. 2, pp. 244-63. • Bishop, JA, Formby, JP and Smith, WJ 1991, ‘International comparisons of income inequality: tests for Lorenz dominance across nine countries’, Economica, vol. 58, pp. 461-77. • Dardanoni, V and Lambert PJ 2002, ‘Progressivity comparisons’, Journal of Public Economics, vol. 86, pp. 99-122. • Luxembourg Income Study (LIS) Database 2010, http://www.lisproject.org/techdoc.htm (multiple countries). • Musgrave, RA and Thin, T 1948, ‘Income tax progression, 1929-48’, Journal of Political Economy, vol. 56, pp. 498-514. • Peichl, A and Schäfer, T 2008, Wieprogressivist Deutschland? Das Steuer- und TransfersystemimeuropäischenVergleich, EUROMOD Working Paper No. EM 01/08 • Sala-i-Martin, X 2006, ‘The world distribution of income: falling poverty and ... convergence, period’, The Quarterly Journal of Economics, vol. 121, pp. 351-97. • Seidl, C 1994, ‘Measurement of tax progression with nonconstant income distributions’, in W Eichhorn (ed.), Models and measurement of welfare and inequality, Berlin: Springer-Verlag, pp. 337-60. • Suits, DB 1977, ‘Measurement of tax progressivity’, The American Economic Review, vol. 67, pp. 747-52.
Q & A • The paper will be soon available as a LIS Discussion Paper (see www.lisproject.org)
Uniform Tax Progression for Different Income Distributions: Discrete Version We start by defining the first-moment distribution functions in discrete terms: Strictly speaking, both components are functions of k. Then we consider the range of the right-hand function to become the domain of the left-hand function, which gives us the discrete first-moment distribution functions. For all curves in terms of q we use the ranking according to gross income, as we have to apply that necessarily also for the curves in terms of p. Moreover, re-ranking does not have dramatic effects [see Peichl and Schäfer (2008)].
Uniform Tax Progression for Different Income Distributions: International Comparisons – DE/UK Def. 1: DE m.p. than UK Def. 2: DE m.p. than UK Def. 3: first UK, then DE Def. 4: DE m.p. than UK Def. 5: DE m.p. than UK Def. 6: DE m.p. than UK Def. 1: first DE, then UK Def. 2: first DE, then UK Def. 3: first UK, then DE Def. 4: DE m.p. than UK Def. 5: first UK, then DE Def. 6 DE m.p. than UK
Uniform Tax Progression for Different Income Distributions: International Comparisons – DE/UK Def. 1: DE m.p. than UK Def. 2: DE m.p. than UK Def. 3: DE m.p. than UK Def. 4: DE m.p. than UK Def. 5: DE m.p. than UK Def. 6: DE m.p. than UK For equivalized data, Germany is more progressive than UK, except ET+ for Definition 2, where we have first DE, then UK. For HT, Germany ist more progressive except Definition 3, for which bifurcate progression, first UK, then DE hold. For HT+, DE>UK holds only for Definitions 4 and 6; first UK, then DE holds for Definitions 3 and 5, and first DE, then UK holds for definition 2 [effect of payroll taxesfor household data]. Def. 1: first DE, then UK Def. 2: DE m.p. than UK Def. 3: DE m.p. than UK Def. 4: DE m.p. than UK Def. 5: DE m.p. than UK Def. 6: DE m.p. than UK
Uniform Tax Progression for Different Income Distributions: International Comparisons – DE/US Def. 1: first DE, then US Def. 2: DE m.p. than US Def. 3: first US, then DE Def. 4: first US, then DE Def. 5: US>DE>US Def. 6: US m.p. than DE Def. 1: first indefinite, then US Def. 2: first US, then DE Def. 3: first US, then DE Def. 4: first DE, then US Def. 5: US m.p. than DE Def. 6: first indefinite, then US
Uniform Tax Progression for Different Income Distributions: International Comparisons – DE/US Def. 1: first indefinite, then US Def. 2: DE m.p. than US Def. 3: DE m.p. than US Def. 4: indefinite Def. 5: first DE, then US Def. 6: first DE, then US There are shifts in bifurcate progression: for household data US more progressive at the bottom, DE at the top. For equivalized data, Germany becomes more progressive at the bottom, US at the top (some exceptions). [Effect of greater families in US?] Def. 1: first indefinite, then US Def. 2: DE m.p. than US Def. 3: DE m.p. than US Def. 4: indefinite Def. 5: first DE, then US Def. 6: first DE, then US
Uniform Tax Progression for Different Income Distributions: International Comparisons – DE/SE Def. 1: DE m.p. than SE Def. 2: DE m.p. than SE Def. 3: first SE , then DE Def. 4: DE m.p. than SE Def. 5: DE m.p. than SE Def. 6: DE m.p. than SE Def. 1: first DE, then SE Def. 2: DE m.p. than SE Def. 3: first SE, then DE Def. 4: DE m.p. than SE Def. 5: DE m.p. than SE Def. 6: DE m.p. than SE
Uniform Tax Progression for Different Income Distributions: International Comparisons – DE/SE Def. 1: DE m.p. than SE Def. 2: DE m.p. than SE Def. 3: first SE, then DE Def. 4: DE m.p. than SE Def. 5: DE m.p. than SE Def. 6: DE m.p. than SE DE more progressive than SE, except for Definition 3, which asserts bifurcate progression: first SE, then DE. For Definition 1, first DE, then SE for HT+, becomes DE>SE for ET+. Def. 1: DE m.p. than SE Def. 2: DE m.p. than SE Def. 3: first SE, then DE Def. 4: DE m.p. than SE Def. 5: DE m.p. than SE Def. 6: DE m.p. than SE
Uniform Tax Progression for Different Income Distributions: Intertemporal Comparisons - UK
Uniform Tax Progression for Different Income Distributions: Intertemporal Comparisons - UK Def. 1: UK95 m.p. than UK91 Def. 2: first UK95, then UK91 Def. 3: first UK95, then UK 91 Def. 4: UK91 slightly m.p. than UK95 Def. 5: UK95 m.p. than UK91 (exc. top) Def. 6: UK 91 slightly m.p. than UK 95 Def. 1: UK95 m.p. than UK91 Def. 2: first UK95, then UK91 Def. 3: first UK95, then UK 91 Def. 4: UK95 m.p. than UK91 (m.exc.) Def. 5: UK95 m.p. than UK91 (exc. top) Def. 6: UK 95 m.p. than UK 91 (exc. top)