Download
1 / 22
220 likes | 318 Views
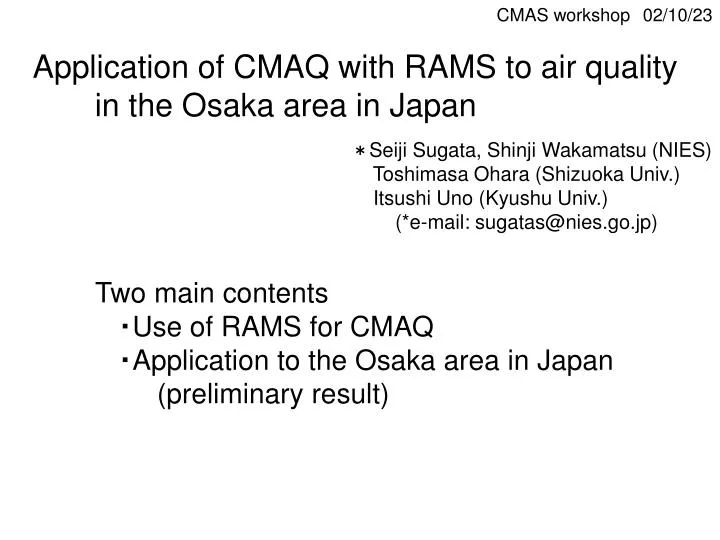
CMAS workshop 02/10/23. Application of CMAQ with RAMS to air quality in the Osaka area in Japan. * Seiji Sugata, Shinji Wakamatsu (NIES) Toshimasa Ohara (Shizuoka Univ.) Itsushi Uno (Kyushu Univ.) (*e-mail: sugatas@nies.go.jp). Two main contents

E N D
CMAS workshop02/10/23 Application of CMAQ with RAMS to air quality in the Osaka area in Japan *Seiji Sugata, Shinji Wakamatsu (NIES) Toshimasa Ohara (Shizuoka Univ.) Itsushi Uno (Kyushu Univ.) (*e-mail: sugatas@nies.go.jp) Two main contents ・Use of RAMS for CMAQ ・Application to the Osaka area in Japan (preliminary result)
Difference of MM5 and RAMS MM5 RAMS Technically points Grid system Arakawa-E Arakawa-C Map projection Lambert Polar-stereo Vertical coordinate sigma-p sigma-z Scientific Hard to say in one sentence Each strong and weak points Users Many Many Most popular regional met. models License Free Necessary
A wide choice of meteorological models for input to CMAQ →increasing flexibility of CMAQ application CMAQ-RAMS interface history - Original idea by Byun and Uno 1999 Interface for CMAQ 1999 and RAMS3b developed by Byun and Sugata 2000 updated for RAMS4.3 (↓Sugata) 2002 updating for CMAQ 2001 updating for CMAQ 2002 (MCIP2) available preparing
Data flow in the interface postprocessing routine Main routines of RAMS (version 4.3) REVU (RAMS Evaluation and Visualization Utility) Modified dumpout.f Met. data in GTOOL format RAMS2IOAPI Met. data in I/O API format CMAQ CTM modified MCIP
Air quality observation campaign in Osaka Aircraft Tokyo Surface Osaka Osaka Bay One month for March, 2001 surface 0m, 60m concentrations of SO2, NOx, Ox, PMs, etc. and high volume sampling for aerosols aircraft 19,20,21,23 March, 2001 concentrations of SO2, NOx, Ox, PMs, etc. and high volume sampling for aerosols
Application of CMAQ/RAMS to the OSAKA area Calculation Period: Mar.15-24,2001 (Aircraft measurement Mar. 19, 20, 21, 23) Resolution: 5km mesh (Polarstereo) 21 layers from 25m up to 19km, interval starts from 50m Domain: Greater Osaka area (next slide) no-nesting RAMS 300km square CMAQ 200km square Emission 1998 data by the Ministry of the environment (10km mesh) Models RAMS4.3 assimilation by ECMWF 0.5 degree mesh 4 times per day CMAQ 1999 ver.
Domain for CMAQ (200km square) Domain for RAMS (300km square) Met. data Nudging by ECMWF one hour at edges two days inside
CMAQ vs. Obs. (Osaka) ○62m obs. ● surface obs. Solid lines: CMAQ NO2 O3 NOx SO2
Vertical profile of concentration of SO2 along the flight path (Red: CMAQ)
Comparison of wind velocity and direction between RAMS and observation at five observational sites, Osaka and neighboring four sites.
Wind velocity and direction RAMS vs. Obs.(Black: RAMS Red: Observation) Direction Velocity Osaka Kobe (west of Osaka)
Wind velocity and direction (RAMS vs. Obs.)Black: RAMS Red: Obs. Direction Velocity Toyonaka (north of Osaka) Sakai (south of Osaka)
Summary of correlation coefficients Gas concentrations (Obs.-CMAQ) NO2 Ox SO2 0.330.51 0.13 (Day/Night) 0.16 / 0.34 0.36 / 0.11 0.16 / 0.05 Met. Field (Obs.-RAMS) Osaka Kobe Toyonaka Sakai Ikomayama Velocity 0.61 0.37 0.61 0.530.59 (Day/Night) 0.68 / 0.17 0.51 / 0.14 0.61 / 0.28 0.64 / 0.13 0.61 / 0.44 Direction 0.37 0.33 0.08 0.60 0.49 (Day/Night) 0.33 / 0.38 0.45 / 0.26 0.11 / 0.12 0.50 / 0.54 0.52 / 0.46 →concentrations <similar coefficients> directions
Summary • - Developing MCIP-RAMS interfaces. • - Simulated air quality in the Osaka area in March 2001 • using CMAQ and RAMS • Compared gas concentrations between CMAQ • and observations (surface and aircraft). • Compared wind velocity and direction • between RAMS and observations. • Simulations reproduce essentially orders of observational • concentrations • but still show quantitative disagreement. • RAMS wind fields • strong wind for night calm air • better in velocity and worse in direction
Next • Development of the interface for MCIP2 • Ready for distribution for those who are interested in • Interested in learning MM5 • To get more realistic RAMS results • One or two more nesting domains • to consider long-range transport • Others