Download

1 / 9
90 likes | 261 Views
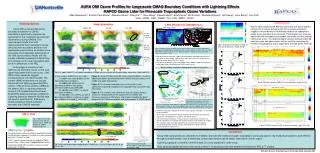
Application of OMI Ozone Profiles in CMAQ. L. Wang 1 , M. Newchurch 1 , A. Biazar 1 , M. Khan 2 , X. Liu 3,4 , D. Byun 5 , B. Pierce 6 1 UAH, 2 USRA, 3 SAO, 4 NASA/UMBC-GEST, 5 UH, 6 UW. Abstract.

E N D
Application of OMI Ozone Profiles in CMAQ L. Wang1, M. Newchurch1, A. Biazar1, M. Khan2, X. Liu3,4, D. Byun5, B. Pierce6 1UAH, 2USRA, 3SAO, 4NASA/UMBC-GEST, 5UH, 6UW
Abstract • Using OMI ozone profiles as the boundary conditions for CMAQ calculations significantly improves the agreement of the model with ozonesonde observations during IONS06. This improvement results from both representing the free-tropospheric ozone amounts more accurately and also from representing recirculating air masses more accurately. • A simultaneous assessment of the OMI ozone profiles directly with the sondes indicates agreement to better than 10% throughout the free troposphere with 10-20% differences in the PBL.
Experiment Description In this study, 4 CMAQ runs are made: • (1) cntrl: uses static profiles as the lateral boundary conditions; • (2) raqms_bc: obtains lateral boundary conditions from global chemical model output (RAQMS); • (3) sat_bc: uses OMI/O3 as lateral boundary conditions; • (4) sat_icbc: uses OMI/O3 as lateral boundary conditions, and once a model-day, modifies simulated O3 with OMI O3.
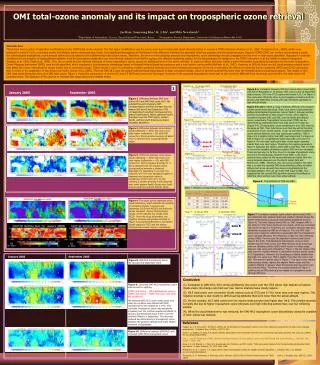
OMI/O3 Data Processing • Ozone Monitoring Instrument (OMI) onboard NASA’s AURA satellite provides mapping of O3 profiles at a nominal ground footprint of 13x48 km2 at nadir. • OMI O3 profiles during each day are gridded to CMAQ domain (36km x 36km resolution) using a “drop-in-the-box” method. • Interpolate gridded OMI O3 profiles (24 layers) onto 39 sigma layers of CMAQ. Fig. 1 OMI O3 retrievals between 1013-701mb during Aug. 21, 2006, are gridded to CMAQ horizontal domain.
Evaluation with IONS06 ozonesondes • IONS06 provides the best set of free tropospheric ozone measurements ever gathered across the continent in a single season data. • Of the IONS06 ozonesondes, 252 are chosen for evaluation of CMAQ results. Criteria include: • Within CMAQ domain; • Launched during UTC1500 ~ 2300, Aug 2006. Fig. 2 IONS06 Ozonesonde network. (http://croc.gsfc.nasa.gov/intexb/ions06.html).
cntrl raqms_bc sat_bc sat_icbc 212 mb (level 33; ~11584 m) 501 mb (level 24; ~5352 m) 853 mb (level 15; ~867 m) Model Evaluations Using OMI boundary (bc) or bc+initial conditions, results in significantly better agreement between CMAQ and the sondes in the middle and upper troposphere. Fig 3. O3 (ppbv) 1900 UTC, 8/21/2006 simulated by 4 CMAQ runs; over plotted with 9 ozonesondes found within 1500~2300 UTC.
Model Evaluations The temporal evolution seen at Huntsville is also significantly improved throughout the troposphere by using OMI ic/bc information. Fig 4. CMAQ simulated ozone variations at Huntsville, AL, during August 2006. Ozonesonde measurements are re-sampled onto CMAQ vertical resolution and over-plotted.
Model Evaluations • The monthly mean difference over 252 sonde stations likewise shows the vertical profile of the improvement in CMAQ with increasing amounts of OMI ozone information, including the direct comparison of OMI ozone profiles and ozonesondes in CMAQ space. Mean of (x-sonde)/sonde (%) Sample size = 252 (varies with altitude) Fig 5. Differences calculated between model simulated O3(ppbv) and ozonesondes, as well as between level-2 OMI/O3 profiles and ozonesondes, during August 2006.
Conclusions • Using OMI ozone profiles as lateral BCs for CMAQ, improves the middle and upper-tropospheric ozone calculations. • By modifying modeled O3 with OMI O3 throughout model domain once a model-day, further improvement can be made, especially in interior region.