Download

1 / 9
90 likes | 200 Views
Draft CMAQ Air Scenarios to Begin in 2005. Presentation to the Modeling Subcommittee Lewis Linker Modeling Coordinator February 8, 2005. Funding allows for eight CMAQ scenarios of nitrate and ammonia deposition. We will want to prepare a list of key air scenarios for the 2007 Reevaluation.

E N D
Draft CMAQ Air Scenarios to Begin in 2005 Presentation to the Modeling Subcommittee Lewis Linker Modeling Coordinator February 8, 2005
Funding allows for eight CMAQ scenarios of nitrate and ammonia deposition. • We will want to prepare a list of key air scenarios for the 2007 Reevaluation. • We will want to examine the CAIR or IAQR whichever is most likely to become law. • We will want to examine future conditions of 2020 when most air reductions will reach zenith. • We will likely want to examine about 20 years into the future, i.e., a 2030 scenario.
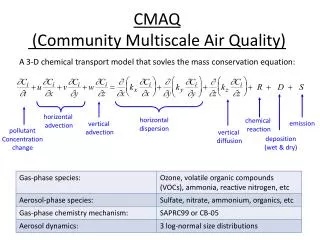
Clean Air Act Nitrogen Oxides (NOx) Scenario Descriptions • Scenario 1 “2007/2010 Base with NOx SIP” • This model run is the Basic 1990 Clean Air Act projected for the year 2010. This scenario includes regulations that have passed. • 2007 non-utility and area source emissions. • 2007 mobile source with Tier II tail-pipe standards on light duty vehicles. • 2010 utility emissions: Title IV (Acid Rain Program) fully implemented; the 20-state NOx SIP call reductions @ 0.15#/Mmbtu. This would be during the ozone season only (May to September). • Scenario 2 “2020 CAA: With Tier II & Heavy Duty Diesel Regulations” • This model run includes Scenario 1, PLUS new heavy duty diesel regulations. • 2020 non-utility and area source emissions (no additional controls). • 2020 mobile source with Tier II tail pipe standards on light duty vehicles (which are now more effective), and heavy duty diesel standards to further reduce NOx emissions. • 2020 utility emissions described in Scenario 1.
Clean Air Act Nitrogen Oxides (NOx) Scenario Descriptions (continued) • Scenario 3 “2020 CAA with Aggressive Utility Controls” • This model run includes Scenario 2, PLUS stringent new utility reductions in SO2 and NOx. • 2020 non-utility and area source emissions (Same as Scenario 2). • 2020 mobile source with Tier II tail pipe standards on light duty vehicles (now more effective), and heavy duty diesel standards to further reduce NOx. (Same as Scenario 2). • 2020 utility emissions with major reductions in SO2 (90% reduction) and further NOx reductions through 2 paths: utilities go to 0.10#/Mmbtu for the entire year. No longer just seasonal reductions. • Scenario 4 “2020 CAA with Aggressive Utility Controls and Industry-Point and Mobile Controls” This would be Chesapeake Bay’s “Limit of Technology” Scenario. • This model run includes Scenario 3, PLUS reductions in non-utility source emissions and mobile source emissions. • 2020 non-utility (industrial) point emissions cut almost in half for both SO2 and NOx. • 2020 area source emissions (same as in Scenarios 2 & 3). • 2020 mobile source: heavy duty diesel standards to further reduce NOx, PLUS super ultra-low emission vehicle assumed for light duty vehicles. • 2020 utility emissions with annual reductions as described in Scenario 3.
26,000 (tons) Base Case Clear Skies Chesapeake Bay Watershed Principle N Airshed NOx Emissions from Electricity Generation Sources withinthe Chesapeake Bay Nitrogen Airshed Projected in 2020:Base Case vs. Clear Skies Source: EPA OAR/OAP/CAMD 3/4/03
State Contributions to Total Nitrate Deposition to Bay Watershed (463 million lbs/yr in 2000) Watershed boundary NOx Airshed boundary Contribute 49% of nitrate deposition to Bay Contribute 27% of nitrate deposition to Bay Contribute 24% of nitrate deposition to Bay
NADP/NTN CASTNET N Deposition Airshed Chesapeake Bay Watershed Long-term Nitrogen Deposition Monitoringin the Chesapeake Bay Region Source: EPA OAR/OAP/CAMD
Atmospheric Inputs: Of the total NOx deposition to the Chesapeake Bay watershed land area, about 50% originates from emissions in Bay-watershed states:__________________ PA = 17%, VA = 10%, MD = 9%, WV = 7%, NY = 5%, DE = 1% OH, NC, NY, KY, IN, TN, MI = 27% Other States in 37-State Area = 24% Delivered Loads From All Sources: Of the total nitrogen load delivered to the Chesapeake Bay watershed, about 23-32% is attributable to atmospheric deposition, based on the proportion of anthropogenic inputs. Direct Atmospheric Deposition to Tidal Water (20.5) Atmospheric Transported from Watershed (77.1)
Relative Contribution of Sources ofNitrogen Loads to the Bay in 2000 ~305 million pounds in 2000 (~98 million due to Air)