Download
1 / 2
20 likes | 103 Views
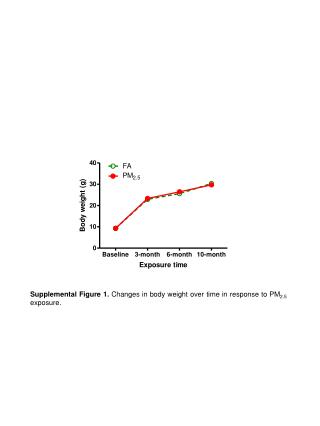
Study on changes in body weight over time in response to PM2.5 exposure, & effects of PM2.5 on iNOS expression in brown adipose tissue. Includes immunohistochemistry analysis & statistical data in BAT depots.

E N D
Supplemental Figure 1. Changes in body weight over time in response to PM2.5 exposure.
A FA PM2.5 B Supplemental Figure 2. Effect of PM2.5 exposure on iNOS expression in interscapular brown adipose tissue (BAT) depots by immunohistochemistry. A. Representative images. Original magnification 200. Arrows indicate the iNOS-positive signals. B. Statistical analysis of iNOS expression in BAT depots.