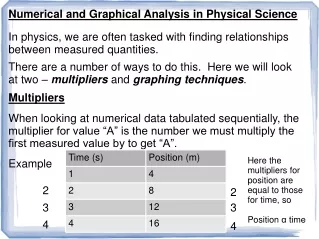
Graphical Data Analysis: Calories Relation to Fat Amounts
Data is plotted on a graph with the independent variable on the x-axis and the dependent variable on the y-axis to analyze the relationship between calories and fat content. A regression line is drawn to best fit the data. Different types of regressions, including linear, power, and sinusoidal are utilized.

Graphical Data Analysis: Calories Relation to Fat Amounts
E N D
Presentation Transcript
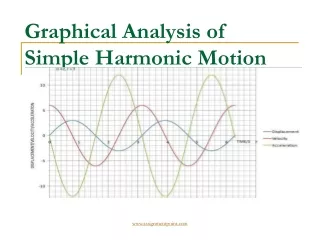
Data • Data collected is plotted on a graph with independent variable on x-axis and dependent variable on the y-axis
Are the calories related to the amount of fat?
Total Cal Total Fat
Regression Line • Line that “best fits” the data is drawn through the points • This line can be represented by an equation for the line
Types of Regressions • Linear – straight line y = ax + b a = slope b = y intercept • Power – curve y = axb • Sinusoidal – wave y = a sin(bx + c)