Research Methods 1998 Graphical design and analysis
290 likes | 469 Views
Research Methods 1998 Graphical design and analysis. Ó Gerry Quinn, Monash University, 1998 Do not modify or distribute without expressed written permission of author. Graphical displays. Exploration assumptions (normality, equal variances) unusual values which analysis? Analysis

Research Methods 1998 Graphical design and analysis
E N D
Presentation Transcript
Research Methods 1998Graphical design and analysis Ó Gerry Quinn, Monash University, 1998 Do not modify or distribute without expressed written permission of author.
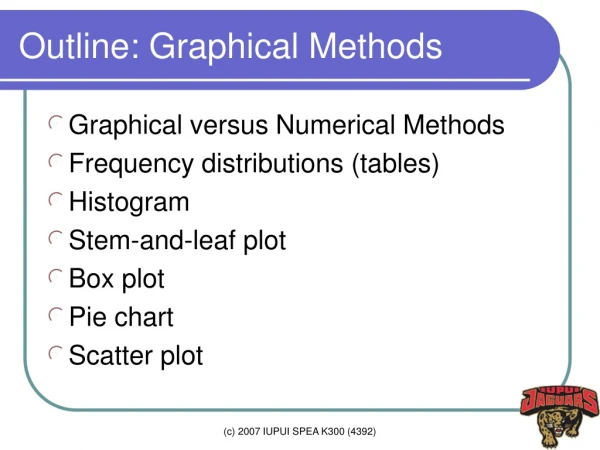
Graphical displays • Exploration • assumptions (normality, equal variances) • unusual values • which analysis? • Analysis • model fitting • Presentation/communication of results
Space shuttle data • NASA meeting Jan 27th 1986 • day before launch of shuttle Challenger • Concern about low air temperatures at launch • Affect O-rings that seal joints of rocket motors • Previous data studied
3 2 Number of incidents 1 0 50 55 60 65 70 75 80 85 Joint temp. oF O-ring failure vs temperature Pre 1986
Challenger flight Jan 28th 1986 - forecast temp 31oF
3 2 Number of incidents 1 0 50 55 60 65 70 75 80 85 o Joint temp. F O-ring failure vs temperature
Checking assumptions - exploratory data analysis (EDA) • Shape of sample (and therefore population) • is distribution normal (symmetrical) or skewed? • Spread of sample • are variances similar in different groups? • Are outliers present • observations very different from the rest of the sample?
Pr(y) y Pr(y) y Distributions of biological data • Bell-shaped symmetrical distribution: • normal • Skewed asymmetrical distribution: • log-normal • poisson
Common skewed distributions Log-normal distribution: • m proportional to s • measurement data, e.g. length, weight etc. Poisson distribution: • m = s2 • count data, e.g. numbers of individuals
Example data set • Quinn & Keough (in press) • Surveys of 8 rocky shores along Point Nepean coast • 10 sampling times (1988 - 1993) • 15 quadrats (0.25m2) at each site • Numbers of all gastropod species and % cover of macroalgae recorded from each quadrat
Frequency distributions Observations grouped into classes NORMAL LOG-NORMAL Number of observations Value of variable (class) Value of variable (class)
Number of Cellana per quadrat 30 Survey 5, all shores combined Total no. quadrats = 120 20 Frequency 10 0 0 20 40 60 80 100 Number of Cellana per quadrat
Dotplots • Each observation represented by a dot • Number of Cellana per quadrat, Cheviot Beach survey 5 • No. quadrats = 15 0 10 20 30 40 Number of Cellana per quadrat
outlier * largest value } 25% of values hinge VARIABLE } " median spread } " hinge } " smallest value GROUP Boxplot
1. IDEAL 2. SKEWED 3. OUTLIERS 4. UNEQUAL VARIANCES * * * * *
Boxplots of Cellana numbers in survey 5 100 80 60 Number of Cellana per quadrat 40 20 0 S FPE RR SP CPE CB LB CPW Site
Scatterplots • Plotting bivariate data • Value of two variables recorded for each observation • Each variable plotted on one axis (x or y) • Symbols represent each observation • Assess relationship between two variables
40 30 20 10 0 0 10 20 30 40 50 60 70 Cheviot Beach survey 5 n = 15 Number of Cellana per quadrat % cover of Hormosira per quadrat
Scatterplot matrix • Abbreviated to SPLOM • Extension of scatterplot • For plotting relationships between 3 or more variables on one plot • Bivariate plots in multiple panels on SPLOM
SPLOM for Cheviot Beach survey 5 CELLANA - numbers of Cellana SIPHALL - numbers of Siphonaria HORMOS - % cover of Hormosira n = 15 quadrats
Transformations • Improve normality. • Remove relationship between mean and variance. • Make variances more similar in different populations. • Reduce influence of outliers. • Make relationships between variables more linear (regression analysis).
Log transformation Lognormal Normal y = log(y) Measurement data
Power transformation Poisson Normal y = Ö(y), i.e. y = y0.5, y = y0.25 Count data
Arcsin Ö transformation Square Normal y = sin-1(Ö(y)) Proportions and percentages
Outliers • Observations very different from rest of sample - identified in boxplots. • Check if mistakes (e.g. typos, broken measuring device) - if so, omit. • Extreme values in skewed distribution - transform. • Alternatively, do analysis twice - outliers in and outliers excluded. Worry if influential.
Assumptions not met? • Check and deal with outliers • Transformation • might fix non-normality and unequal variances • Nonparametric rank test • does not assume normality • does assume similar variances • Mann-Whitney-Wilcoxon • only suitable for simple analyses
Cheviot Beach Sorrento 30 30 25 25 20 20 Mean number of Cellana per quadrat 15 15 10 10 5 5 0 0 1 2 3 4 5 6 7 8 9 10 1 2 3 4 5 6 7 8 9 10 Survey Category or line plot Mean number of Cellana per quadrat Survey