Download
1 / 19
190 likes | 360 Views
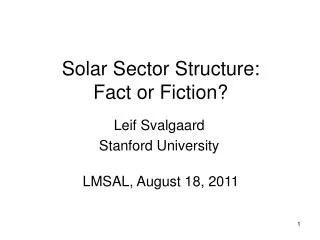
Solar Sector Structure: Fact or Fiction?. Leif Svalgaard Stanford University. LMSAL, August 18, 2011. Discovery of Sector Structure. Quasi-Stationary Corotating Structure in the Interplanetary Medium John M. Wilcox & Norman F. Ness ( 1965 ), JGR, 70, 5793.

E N D
Solar Sector Structure: Fact or Fiction? Leif Svalgaard Stanford University LMSAL, August 18, 2011
Discovery of Sector Structure Quasi-Stationary Corotating Structure in the Interplanetary Medium John M. Wilcox & Norman F. Ness (1965), JGR, 70, 5793. The large-scale structuring of the IMF was a surprise at the time IMP 1 Sector Boundary It was also noted that solar storms could briefly disrupt the structure
The Structure Organizes Solar Wind Properties and Responses to those V n ΣKp Solar Wind High-speed Stream Density Spike Geomagnetic Activity Also: Cosmic Ray Intensity, IMF Strength, Flares, UV Flux, Green Corona, etc. Almost anything was later claimed by people to be organized by the structure: Weather, Agitation of Inmates in Mental Institutions, etc. Like Global Warming today causes everything…
Organization is Robust (Co-rotating Interaction Regions) Superposed Epoch ~1000 Boundaries
Rotation Plots of the Sector Polarity CH CH Skylab Workshop, 1976 1 27 Bartels Rotations
The Heliospheric Current Sheet Artist: Werner Heil Cosmic Ray Modulation caused by latitudinal variation of HCS and CIRs Svalgaard & Wilcox, Nature, 1976
The Potential Field Source Surface Model Illustrates Many First-Order Effects 1976 12 4 Flattening with Polar Fields Simplification and Flattening with Height “Domes of closed field lines”
The Importance of the Polar Fields Even with all the sophistication of current models of the Corona and HMF they are hostage to the correct value of the solar polar fields, which may be different at the two poles and even have longitudinal structure within the polar caps. This is particularly important at solar minimum when the HCS is largely flat. Pneuman & Kopp, 1971 MHD Vseskhsvjatsky, 1963 1954 Eclipse
Rotation Plots of Polarity Recurrent for years Towards, - Away, + In 1954 the HCS was so flat that the Earth was above the sheet for six months at a time Rosenberg-Coleman Effect
How do we know the Sector Polarity Before the Space age? The HMF reconnects with the Earth’s magnetic field and deforms it depending on the sign of the HMF. This creates an electric current vortex, whose magnetic effects we can measure on the ground: Away Toward Data goes back to 1926
Dominant Polarity: Rosenberg-Coleman Effect Proves Polar Field Reversals in the Past
FFT Power Spectrum of Polarity Recurrence 1926-2011 R-C Effect Solar cycle The Recurrence Line is split into several lines
Recurrence Peak: Fine Structure “26.9” “27.2” “28.15” “27.03” Toy Example The 27.03 line is an artifact having contributions from the 26.9 and 27.2 lines
Average Recurrence Period in Solar Wind Data “On average, solar magnetic field lines in the ecliptic plane point outward on one side of the Sun and inward on the other, reversing direction approximately every 11 years while maintaining the same phase. The data are consistent with a model in which the solar magnetic dipole returns to the same longitude after each reversal.” Neugebauer et al., 2000
Recurrence Period depends on Solar Cycle Phase 26.85 d before polar field reversal 27.15 d after polar field reversal Autocorrelation at different lags shows peaks at n * P(n) Svalgaard & Wilcox, 1975
Active Longitudes [an Example] The Physics of Chromospheric Plasmas ASP Conference Series, Vol. 368, 2007 Regularities in the Distribution of Solar Magnetic Fields V. Bumba, M. Klvǎna and A. Garcia Abstract. We examined the distribution and concentration of the solar magnetic fields from the Wilcox observatory synoptic charts for the whole period of their existence (May 1976 – February 2006). We divided them into four latitudinal zones, studying the changes of their various structures, density, etc. These sets of maps demonstrate striking regularities in the photospheric magnetic field distribution with time, continuous existence of characteristic longitudes of magnetic field concentration and their longitudinal shift with three main rotational periods of 26.8, 28.2, and 27.14 days. They show formation of specific structures of background weaker fields, connected with the development of activity complexes, polarity alternation, etc…
Hale Boundaries and Flares SC23 Distribution of RHESSI flares within ±24 hr of 223 sector boundaries mapped back to central meridian (dashed vertical line) for part of solar cycle 23, 2002 March to 2008 March. The left and right panels show the (−, +) and (+,−) boundaries, respectively. The green boxes show where flares are expected, based on association with strong magnetic fields, i.e., at the Hale boundary. The dashed purple boxes show that hardly any flares occur near a non-Hale boundary. The number of flares in each distribution is shown above each plot. Only flares within ±85° of CM are counted. The small dashed line circles show the center of the bias area for the RHESSI imaging axis.
Recent X7 Flare on Hale Boundary Is the magnetic field already ‘stressed’ when emerging if on a Hale Boundary? McClymont & Fisher (1989) make this case generally: the emerging flux adds stressed magnetic fields directly to the lower solar atmosphere, storing the non-potential energy needed for flaring.
The Issue • Is the solar sector structure the result of surface flux transport of essentially randomly distributed flux? • Or is the sector structure the result of deep-seated solar processes, resulting in longitudinal organization of the field? • Helioseismology might discover longitudinal structures and flows (if we look for them)