Download
1 / 10
100 likes | 216 Views
Molecular Gas and Dust in COSMOS Submillimeter Galaxies.

E N D
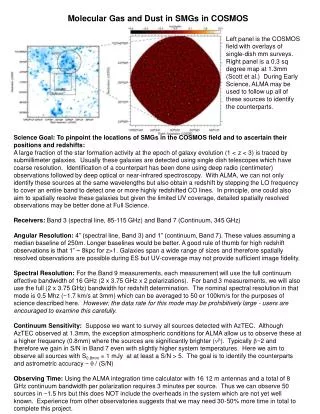
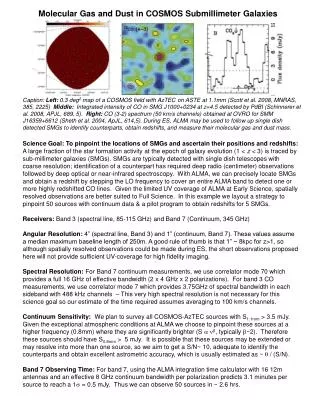
Molecular Gas and Dust in COSMOS Submillimeter Galaxies Caption: Left: 0.3 deg2map of a COSMOS field with AzTEC on ASTE at 1.1mm (Scott et al. 2008, MNRAS, 385, 2225) Middle: Integrated intensity of CO in SMG J1000+0234 at z=4.5 detected by PdBI (Schinnerer et al. 2008, APJL, 689, 5). Right:CO (3-2) spectrum(50 km/s channels) obtained at OVRO for SMM J16359+6612 (Sheth et al. 2004, ApJL, 614,5). During ES, ALMA may be used to follow up single dish detected SMGs to identify counterparts, obtain redshifts, and measure their molecular gas and dust mass. Science Goal: To pinpoint the locations of SMGs and ascertain their positions and redshifts: A large fraction of the star formation activity at the epoch of galaxy evolution (1 < z < 3) is traced by sub-millimeter galaxies (SMGs). SMGs are typically detected with single dish telescopes with coarse resolution; identification of a counterpart has required deep radio (centimeter) observations followed by deep optical or near-infrared spectroscopy. With ALMA, we can precisely locateSMGs and obtain a redshift by stepping the LO frequency to cover an entire ALMA band to detect one or more highly redshifted CO lines. Given the limited UV coverage of ALMA at Early Science, spatially resolved observations are better suited to Full Science. In this example we layout a strategy to pinpoint 50 sources with continuum data & a pilot program to obtain redshifts for 5 SMGs. Receivers: Band 3 (spectral line, 85-115 GHz) and Band 7 (Continuum, 345 GHz) Angular Resolution:4” (spectral line, Band 3) and 1” (continuum, Band 7). These values assume a median maximum baseline length of 250m. A good rule of thumb is that 1” ~ 8kpc for z>1, so although spatially resolved observations could be made during ES, the short observations proposed here will not provide sufficient UV-coverage for high fidelity imaging. Spectral Resolution: For Band 7 continuum measurements, we usecorrelator mode 70 which provides a full 16 GHz of effective bandwidth (2 x 4 GHz x 2 polarizations). For band 3 CO measurements, we usecorrelator mode 7 which provides 3.75GHz of spectral bandwidth in each sideband with 488 kHzchannels – This very high spectral resolution is not necessary for this science goal so our estimate of the time required assumes averaging to 100 km/s channels. Continuum Sensitivity: We plan to survey all COSMOS-AzTECsources withS1.1mm > 3.5 mJy. Given the exceptional atmospheric conditions at ALMA we choose to pinpoint these sources at a higher frequency (0.8mm) where they are significantly brighter (S a nb, typically b~2). Therefore these sources should have S0.8mm > 5 mJy. It is possible that these sources may be extended or may resolve into more than one source, so we aim to get a S/N~ 10, adequate to identify the counterparts and obtain excellent astrometric accuracy, which is usually estimated as ~q/ (S/N). Band 7 Observing Time: For band 7, using the ALMA integration time calculator with 16 12m antennas and an effective 8 GHz continuum bandwidth per polarization predicts 3.1 minutes per source to reach a 1s = 0.5 mJy. Thus we can observe 50 sources in ~ 2.6 hrs.
Spectral Line Sensitivity: Bright SMGs(S0.8mm > 5 mJy) typically have an integrated CO flux of 1—4 Jy km/s for a range of CO transitions (see review by Solomon & Vanden Bout, 2005, ARAA, 43, 677). We therefore aim to detect a signal of 5 mJy in a 100 km/s channel at 100 GHz (Band 3) with a S/N of 5 (1 mJy in 100 km/s). Since EScorrelator mode 7 provides a native channel spacing of 488.3 kHz (~1.5 km/s) the 1 mJy per 100 km/s requirement translates to a sensitivity goal of 8 mJy per (unbinned) channel. Band 3 Observing Time: To cover the entire Band 3 frequency range requires setting the LO to ~5 frequencies, namely 92, 96, 100, 104 and 108 GHz (Note that this method will result in the spectral range 96—104 GHz being sampled twice, once in the USB and once in LSB of different LO settings). Using the ALMA integration time calculator with 16 12m antennas and a desired sensitivity of 8 mJy per 488.3 kHz channel predicts integration times of ~10 minutes for each LO setting. Thus each galaxy requires ~50 minutes of total integration time. For 5 galaxies, this translates to 4.2 hrs. Thus overall, this program would require 6.8 hrs of integration time. Data Rate: XX Mb/s In the future: 50 antennas will significantly decrease the time for the blind redshift searches as described above to ~1 minute per LO setting and provide the instantaneous UV coverage needed to map the galaxies. However to do large surveys of galaxies, known redshifts will significantly improve the efficiency of observations. Also note that at very highest redshifts (z > 6), Band 3 will be observing CO lines higher than J=7->6 which may not be as bright as the lower-J CO lines. Caption: A screenshot of the OT target list for the continuum observations. A list of sources may be uploaded into the OT as a simple ascii file. Caption: Two screenshots of different LO settings for Band 3 observations to get a CO redshift for one of these SMGs.
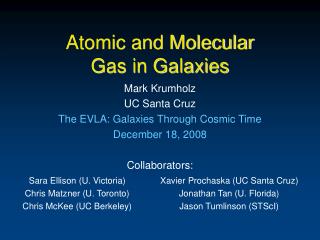
Imaging Molecular Gas in a Nearby Starburst Galaxy Caption: NGC 3256, a nearby luminous infrared galaxy, as imaged by the SMA (Sakamoto et al. 2006). (Left) Integrated CO(2-1) intensity at 2”x1” resolution, (Middle) peak CO(2-1) intensity along each line of sight, (Right) mean velocity along each line of sight derived from the CO line. During Early Science, ALMA will be well-suited to make comparable observations. Science Goal:Measure the distribution and kinematics of molecular gas in a nearby starburst galaxy. The starbursts in luminous and ultraluminous infrared galaxies tend to be small (~1 kpc) and even the nearest of these galaxies are still quite distant in absolute terms (10s of Mpc). Exploring the distribution, kinematics, and physical conditions of the gas and dust in these systems is a natural application for sub-mm interferometers. ALMA's Early Science capabilities are well-suited to study the nearest such galaxies. Here we work through an example based on an SMA study of CO emission from NGC 3256 by Sakamoto et al. (2006). Receivers:Band 6(230 GHz).Molecular gas in starbursts tends to be fairly excited, making either CO(3-2) in Band 7 or CO(2-1) in Band 6 fine tools to probe the gas. The whole source is ~5 kpc in size or ~30” at 35 Mpc, which is also about the field of view at Band 6. Angular Resolution:~1”. We want to resolve the central disk of molecular gas hosting the starburst. These disks are often ~1 kpc in size, and this is the case NGC 3256. At 35 Mpc, this is only ~5”. To clearly resolve the starburst, we target a resolution of ~1”. Spectral Resolution:~ 5 km s-1.We want to be able to measure the velocity dispersion along individual lines of sight. This is ~10-60 km s-1 (1σ) so we target 5 km s-1 , ensuring >5 resolution elements across the line. This is worse than the coarsest channel width allowed by the correlator in mode 7 so we will observe at 0.7 km s-1 (0.5 MHz, mode 7) and smooth afterwards. Channel (Line) Sensitivity:0.2 at 5 km s-1 (12CO) and 0.02 K at 20 km s-1 (13CO). Sakamoto et al. (2006) report peak 12CO(2-1) intensities of 2-10 K in 10 km s-1 channels at ~1.5” resolution, so we target a 1σ sensitivity of 0.2 K per 5 km s-1 channel for peak SNR 10. We also want to observe the optically thinner 13CO line. This requires a second tuning (a separate observation) and is often 5-10 times fainter than 12CO. We assume a line ratio of 10 and so target 0.02 K. If 13CO is much weaker, as Sakamoto et al. actually found, we can improve the SNR by degrading the angular resolution. The 12CO data meet our kinematic goals so we target a lower spectral resolution of 20 km s-1 for 13CO, enough to ensure 1 channel across the line. Continuum Sensitivity: N/A. Continuum could easily be a goal of this project, especially if we had chosen Band 7, but we will not focus on it in this example except to say that any unused correlator resources can be put to good use observing the 1mm (Band 6) dust continuum.
Observing Requirements: Putting in 16 antennas with the appropriate frequencies and spectral resolutions, the ALMA sensitivity calculator suggests that we need 3.5 hours on source to achieve 0.02 K for 1” beam and a 20 km s-1 (13CO) and 7 minutes to achieve the 0.2 K per 5 km s-1 channel targeted for 12CO (the observing tool will calculate appropriate overheads). If accurately recovering the extended structure is a main science goal, we will want to consider not only sensitivity but u-v coverage. The original SMA data were observed in 7h over the course of two nights and two configurations. With ALMA's 16 antennas ~ 2 hours spread across a comparable LST range should be sufficient to achieve matching image quality. If we want to achieve comparable u-v coverage with these observations, we will need to increase the sensitivity request for the 12CO tuning accordingly (to ~ 0.05 K) and request that these ~2h be spread across the full range of LST when the source is up. Data rate: XX MB/s In the future: More antennas and large baselines will make it possible to observe more distant systems at similar spatial resolution. Larger baselines also allow improved resolution to study the structure in more detail. Both of these will come at the cost of increased observing time. Short spacing observations from the ACA and total power antennas would be useful for this kind of application. These will be especially important to study the dust continuum. Caption: Screen shot of OT Proposal Screen. Here the user enters the title, abstract, and investigator list, selects the science category and provides other background information. An interface at the bottom of this page allows (shown as inset) allows the user to upload PDFs containing science and technical cases and supporting material.
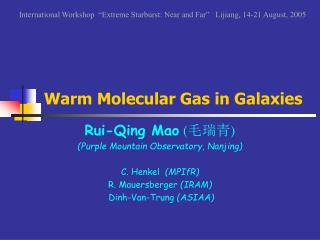
Chemical and Evolutionary Diversity in a Massive Protostellar Cluster 2” Caption: Left: Colorscale and white contours show a SubmillimeterArray (SMA) continuum image at 1.3 mm (222 GHz) of NGC6334I (Brogan et al. in prep) with a resolution of ~ 0.5”. The magenta contours show VLA 3.6 cm continuum from a UCHII region. Right: Spectra of three of the sources showing the diversity of chemistry toward the protostars. Science Goal: To observe the molecular chemistry and kinematics of the massive protostellar cluster NGC6334I. When a massive star forms, photoionization of dust grains liberates complex organic molecules leading to a hot core phase. Subsequent expansion of the ionized region leads to a detectable ultracompact HII region. In this target, objects in all three phases appear to be present within 10000 AU of one another, in a configuration similar to the more evolved Trapezium cluster. ALMA will better reveal the kinematics toward the hot cores and will determine whether accretion structures are present, which of the objects drive outflows, detect dust emission from lower mass protostars, and determine how these massive members affect the lower mass protostars in this active star-forming cluster. Receivers: Bands 6 and 9 (220 GHz and 670 GHz). Band 6 is needed to minimize the effects of dust opacity on the line emission from the hot cores, and Band 9 is needed for the highest angular resolution and to characterize the spectral index and dust emissivity. We will observe many useful molecules in both bands that provide temperature measurements including CH3CN, CH3OH, and C2H5CN, and shock tracers such as SiO and SO2. Angular Resolution: 1”.3 (Band 6) to 0”.5 (Band 9),.The typical separation of massive protostars in this cluster is ~2000 AU which is about 3” for this source (d=1.6 kpc). Assuming a maximum baseline of 250m, the 1.3” beam at Band 6 can comfortably separate the sources. However, because the hot core emission is smaller than 1000 AU, subarcsecond observations are needed to avoid loss of sensitivity due to beam dilution. The Band 9 observations will achieve 0.5” resolution. The 28” FOV at Band 6 is sufficient to cover the 20” region of interest in a single field, but to cover it with the 9” FOV at Band 9 will require a 19-point mosaic. Spectral Resolution:The 230 GHz SMA observations have 0.4 MHz = 0.5 km/s wide channels. Using ES correlator mode 7, we can get dual polarization and 4 GHz (3.75 GHzusable) bandwidth in each sideband with 0.5 MHz (0.65 km/s) channels in Band 6. For Band 9 using this mode we will get 0.23 km/s channels, which we can either smooth for additional sensitivity or use to study the kinematics with greater spectral resolution.
Sensitivity and Observing time: The 230 GHz SMA spectra have 40 mJy/beam/channel rms. Using the ALMA integration time calculator with 16 12 m antenna, dual polarization and 0.5 MHz channels, these point source sensitivities can be achieved in only 4 minutes at Band 6 and 1.9 hours for one field at Band 9. With Nyquist sampling of the mosaic, the time needed to reach this sensitivity with 19 overlapping fields is about 1.9 hrs*(19/sqrt(2)) = 25.5 hours in Band 9. Note that this mosaic will not be sensitive to structures larger than about 10” without compact array and total power data. To match the uv-coverage of Band 9 (and the SMA observations), we actually need 1.5 hours at Band 6 – this is the number that should be used in the OT. Because both bands will have line-free areas, the continuum sensitivity will correspond to a substantial fraction of the total bandwidth for continuum rms noise levels of about 0.05 mJy at Band 6, and 0.3 mJy in Band 9. These relative sensitivities provide a good match to the typical spectral index of dust emission and will enable detections of the low-mass protostars associated with the cluster. Data rate: XX MB/s In the future: As ALMA’s maximum baseline length increases, the hot cores in this example can be better resolved at all wavelengths, and with matched angular resolution. The science case presented here can be expanded to search for binary protostars and to resolve their individual protostellar disks within each hot core. Band 3 observations at the same angular resolution of 0.4” for Band 9 would allow us to investigate the small-scale free-free emission and presence of hypercompact HII regions. However, these observations will require a maximum baseline of 1.5 km. Caption: Screen shot of OT Spatial Editor for Field Setup. An existing fits file has been loaded and the proposed mosaic rectangle is superposed. During ES it may be necessary to specify the pointing centers of the 19 pointings of the mosaic as though you were observing 19 individual fields. Later the mosaic pattern will be derived automatically.
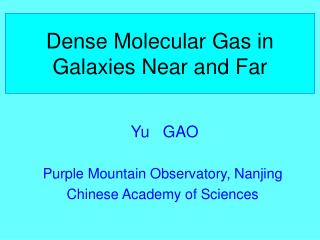
Multiwavelength Continuum Survey ofProtostellar Disks in Ophiuchus Caption:Top: CARMA aperture synthesis images of 1.3mm (228 GHz) continuum emission from two protostellar disks in Taurus with an inset to highlight the double structure seen in the top left panel (Isella et al. 2010, ApJ, 714, 1746).Bottom:CARMA images of the 2.8mm (106 GHz) emission from the same two disks (Isellaet al.). Each imageincludes~8 hours of data for each of several different CARMA configurations,fora synthesized beam of ~ 0.15” FWHM at 1.3mm and ~0.4” at 2.8mm. During Early Science, ALMA will achieve ~0.4” angular resolution in Band 9 (690 GHz)withsimilar uv-coverage to CARMA for a given observing time. The sensitivity of ALMA during ES will be better (for a given observing time, due to increased collecting area and continuum bandwidth. Science Goal: To observe the variation in the dust spectral energy distribution (SED) betweenprotostellardisks in the nearby Ophiuchus molecular cloud: The characteristics of dust in a disk around a protostar are expected to evolve over time, as dust grains settle to the disk midplane, accumulate into larger solid bodies, and potentially form planets within the disk. The evolution of the disk may be traced by determining the dust SED of a coherent sample of protostellar disks. Wide frequency coverage is necessary to achieve these aims, since the SED of the disk is determined by a combination of the dust temperature, the dust emissivity properties, and the optical depth through the disk. Nearby protostellar disks will not be resolved by ALMA at all frequencies during Early Science, but the Early Science collecting area will allow high sensitivity observations of the disk-averaged SED in a short observation. Here, we present a proposal to observe 6 Class II protostellardisks selected from the catalogue presented by Evans et al. (2009, ApJS, 181, 321). Receivers: Bands 3, 6, 7 and 9 (110 GHz, 230 GHz, 345 GHz and 690 GHz) Angular Resolution: 0".4 (Band 9) to 2".2 (Band 3), assuming a maximum baseline of 250m. The typical size of a protostellardisk is ~100 AU. Towards the nearest molecular clouds, such as Ophiuchus (at 125 pc), 100 AU subtends only 0".8, and may only be resolved in Band 9 during Early Science. Here we will focus on the global properties of the disks. Spectral Resolution: N/A Each measurement will include the largest bandwidth possible. Continuum Sensitivity: 0.4 mJy, 3 mJy, 8 mJy and 40 mJy for Bands 3, 6, 7, and 9, respectively. These are the expected point source sensitivities needed for 10σ detections in each band, assuming a disk mass of 0.01 MSun, an average dust temperature of 20 K, a plausible dust emissivity and a distance of 125 pc. Observing Requirements:Using the ALMA integration time calculator with 16 12 m antennas and 16 GHz effective bandwidth (ES Correlator mode 70), these point source sensitivities can be achieved in 9s per disk (Band 3), 0.7s per disk (Band 6), 0.4s per disk (Band 7) and 0.2s per disk (Band 9). However, to match the uv-coverage of the CARMA observations in the above figure and properly image the disks in the case that they are resolved, each of the six disks
should be observed repeatedly over the course of ~8 hours at each frequency, giving a time per disk of ~1 hour. In 1 hour, we would achieve sensitivities of 0.02, 0.04, 0.08 and 0.3 mJyin Bands 3, 6, 7 and 9, respectively. These should be the sensitivities requested in the Observing Tool to obtain proper uv-coverage of the protostellar disks. Data rate: XX MB/s In the future: As ALMA’s maximum baseline length increases, the disks in this example can be resolved at all wavelengths, with matched angular resolution. With greater angular resolution, the science case presented here can be expanded to study the variation of the dust SED as a function of disk radius, and to look for holes in emission which may indicate the presence of gaps in the disks. The resolved disks will require a greater amount of observing time, for sensitivity (using the surface brightness rather than point source mode with the ALMA integration time calculator). The number of antennas will increase during Early Science, however, reducing the amount of time required to obtain the same uv-coverage. To match the Band 9 angular resolution of 0.4” discussed above at Band 3 requires a maximum baseline of 1.5 km. Caption:Top: Screen shot of OT Control and Performance parameters. Bottom: Sensitivity Calculator
Continuum and CO J=3-2 Emission from the Pluto-Charon System Caption:SubmillimeterArray (SMA) aperture synthesis images of1.4 mm (220 GHz) continuum emission of Pluto and Charon (Gurwell&Butler. 2005 BAAS 37, 743). These observations were made with the most extended SMA configuration during an 8 hour track, achieving a synthesized beam of ~ 0.4” FWHM. During Early Science, ALMA will achieve similar angular resolution in Band 9 (690 GHz) with integration times of ~2.5 hours required to obtain similar uv-coverage. Science Goal: To observe the CO line on Pluto and to measure the fluxes of both Pluto and Charon. For Pluto, N2 is the dominant atmospheric molecule, but minor species, methane and CO, dominate the thermal balance as they have a spectrum which better permits radiative activity, particularly when Pluto is closest to the Sun. Methane observations suggest an atmospheric temperature considerably warmer (~100K) than the surface (~45K) but CO has not been detected. These observations will constrain atmospheric models; the New Horizons spacecraft is expected to provide in situ measurements during its 2015 flyby. These observations will also constrain the surface temperature of both bodies, and put limits on the sizes of the exterior moons Nix and Hydra. Receivers: Bands 7 and 9 (345 GHz and 690 GHz) Angular Resolution: 0".4 (Band 9) to 0”.7 (Band 7), assuming a maximum baseline of 250m. The typical separation of Pluto and Charon is ~0”.9 so the two will be well-resolved at 690GHz but barely so, if at all at 345GHz. Fluxes are expected to be 100 and 20 mJy for Pluto at the two frequencies, and 40% of that for Charon. The predicted intensity of the CO line from Plutorange from about 50 to 120 mJyin a 1 km/s line. This should be detectable in a few hours of integration. Spectral Resolution:To resolve the expected 1 km/sline width requires a spectral resolution of about 0.2 km/s. We will use Correlatormode 12, but since this provides far more spectral resolution than required (15 kHz, or 0.013 km/s and 0.0065 km/s at 345 GHz and 690 GHz respectively) we will average channels to improve the sensitivity and achieve the desired 0.2 km/s spectral resolution. Continuum Sensitivity: 0.03 mJy and .12 mJy for Bands 7, and 9, respectively. These are the expected point source sensitivities needed for 5σ detections of Nix and Hydra in each band, if the radii are near 150km. Nix and Hydra are 2-3 times the distance from Pluto of Charon and will be present in the same submillimeter beam. Line Sensitivity: 1 mJy km/s Band 7. The excited J=6-5 CO line at 690 GHz is expected to be undetectable given the 90K temperature expected for the atmosphere. An LVG calculation shows it should only be 10% of the intensity of the J=3-2 line.
Observing Time: Using the ALMA integration time calculator with 16 12 m antennas and 4 GHz bandwidth, these point source sensitivities can be achieved in 40m (CO3-2 Band 7), 1h for the simultaneously observed 345 GHz continuum, and 2h (Band 9). Observations of the CO line in Pluto, and of the continuum emission from Pluto and Charon (and perhaps Nix and Hydra) a total of 4 hours of observation in good weather. Pluto is well-placed for winter observation. Data Rate: 12.3MB/s for 345 GHz; 1.2 MB/s for 690 GHz. Volume: 36.5 and 7.1 GB, respectively. In the future: As ALMA’s maximum baseline length increases, the moons in this example can be resolved at all wavelengths. Other CO lines may be measured in order to put better constraints on the atmospheric structure. Increased sensitivity will enable the array to detect Nix and Hydra, which may be smaller and emit less flux. The flux measurement will provide a good estimate of the size and density of these small and enigmatic moons. Better orbital parameters will help to guide the New Horizons spacecraft during its 2015 encounter with the system Caption: Screen shot of OT showing the Spectral Setup Visualization Tool for the Pluto/Charon example.