Download
1 / 19
190 likes | 332 Views
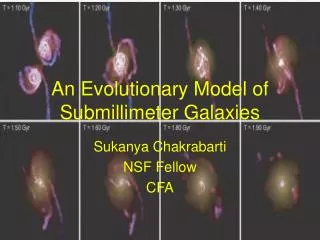
An Evolutionary Model of Submillimeter Galaxies. Sukanya Chakrabarti NSF Fellow CFA. Merging Galaxies, Starbursts. Toomre & Toomre (1972): “ Galactic collisions can bring deep into a galaxy a fairly sudden supply of interstellar material ” Hydrodynamic simulations –

E N D
An Evolutionary Model of Submillimeter Galaxies Sukanya Chakrabarti NSF Fellow CFA
Merging Galaxies, Starbursts • Toomre & Toomre (1972): • “Galactic collisions can bring deep • into a galaxy a fairly sudden supply • of interstellar material” • Hydrodynamic simulations – • Mihos & Hernquist (1996) – galactic • bridges & tails, starbursts Sanders & Mirabel (1996) Dusty, Infrared Bright Galaxies ULIRGs – LIR > 1012 Lsun Mergers
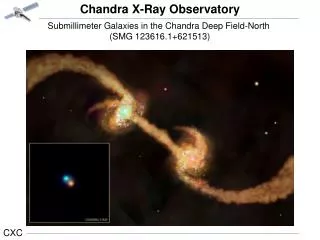
Merging Galaxies, Starbursts & AGN (fast-forwarding a few years…) Chandra image of NGC 6240: (Komossa et al 03) Recent Hydrodynamical Simulations with Black Holes: Springel et al. 2005
Submillimeter Galaxies SMM J02399-0136 (Genzel et al 03) • Massive galaxies, with SFR of ~500-1000 Msun/yr. Sub-mm SCUBA surveys in late 90s (Smail et al 2000, Ivison et al. 98). • SMGs: F850 > 1 mJy. Spectroscopic redshifts for higher redshift population (z~2), median F850 ~ few mJy for z~2 population. • Before Spitzer and SHARC-2 observations (Kovacs et al. 2006), mostly 850 micron, some 450 micron, radio observations, CO, and some mm imaging. • X-ray observations - Alexander et al. (2005) – AGN in SMGs. Total contribution of AGN to luminosity not known.
How I study Dusty Galaxies (Feedback DrivenMethod of Study) Simulations of Galaxy Mergers Radiative Transfer Calculations (RADISH): Images, SED template factory, 6 panel movies Infrared, CO (D. Narayanan), Lyman continuum, Lyman-alpha Compare to observations - refine and calibrate models
Outline of Talk • Simulations with AGN Feedback • and starburst feedback for local LIRGS & ULIRGs - evolution of far-IR SEDs. Cold-Warm IRAS classification. • General trends: do these two kinds of feedback affect the evolutionary history differently? • Submillimeter Galaxies at z ~ 2: • Photometric Properties: IRAC color-color plot • What is the Role of AGN in SMGs: • Infrared X-ray correlations • Photo Albums of SMGs during their lifetimes • Classfication & Evolutionary Scheme for SMGs • Star Formation in Recent High Resolution Simulations of • Quiescent Galaxies
Basics of Radiative Transfer Low Intermediate High Optical depth temperature • Contribution functions & SEDs from Chakrabarti & McKee 2005 • L/M and S. Source of illumination does not matter for reprocessed far-IR SED • What does self-consistent RT calculation mean: div F =0 -> Radiative Equilibrium.
RADISH: Photons that emerge undergo: attenuation,scattering, reemission AGN Unresolved Sources Temperature: Radiative Equilibrium Resolved Sources Chakrabarti & Whitney 2007
General Trends: Cold-Warm Transition: Telling AGN & Starbursts Apart • AGN feedback: • disperses gas • more effectively – lower • columns – more high • frequency flux at peak of luminosity. • Source of illumination • irrelevant • F(25)/F(60) increases with mass loading efficiency of starburst winds. • Chakrabarti, Cox, et al. 2007a (and in Spitzer’s MIPS & Herschel’s PACS), • SB winds - Cox,Chakrabarti,et al.2007 solid line: AGN feedback. Dotted: h=0.5, dashed: h=0.05,dash dotted: h=0.005 (focus on typical observed values (Martin 05,06,Rupke et al 05)
Predictions for Herschel: Cold –Warm Trend: Telling AGN & Starbursts Apart From Chakrabarti et al. 2007a
IRAC color-color plot Bunny-ear shape Hot dust Lacy et al. (2004) from Spitzer FLS. Dashed lines mark “AGN-demarcated region” clustering
IRAC color-color plots AGN demarcated region • What is the clustering in the color-color plot due to? (Chakrabarti et al. 2006b) clustering
Unfolding IRAC color-color plots • Clustering in color-color plots – correlated with time spent in region of color space and stars dominating in bolometric luminosity output. Clustering: time Hot dust: LBH > Lstar Clustering: stars
IRAC color-color plot Bunny-ear shape Hot dust clustering IRAC color-color plot for z=0.3 slice, bunny- ear shape. IRAC color-color plot in rest-frame
Towards An Evolutionary Scheme for SMGs Chakrabarti et al. 2007b. SMG phase short-lived: Class I,II only, dust emission ~10 kpc
Transition from Class I -> Class II : SEDs of SMGscold warm SED Fit to SMG data of z~2 galaxy in Pope et. al 2006. Close to Class II phase, with BH ~ 80 % of L, SFR ~ 300 Msun/yr SED Fit to SMG data of z~1 galaxy in Pope et al. 2006. Close to Class I phase, With BH ~ 40 % of L, SFR ~ 500 Msun/yr
If you have any (radiative) transfer problems … Please call: 1-800-RADISH
Future Directions • Interfacing Simulations & Multiwavelength Observations to understand galaxy evolution: Future Space Missions: Herschel Space Observatory & JWST. • High Resolution Simulations of Mergers • Kazantzidis, Mayer (~few pc) • Physical Models of AGN Feedback (Ciotti & Ostriker 07) • High Resolution Simulations of Spiral Galaxies: how does spiral structure arise? Why does it persist? How does it affect star formation?