Download
1 / 15
150 likes | 370 Views
MIR Diagnostics and Molecular Gas in Local Luminous Infrared Galaxies . Andreea Petric Collaborators: L. Armus, J. Howell, J. Surace (SSC/Caltech), A. Evans (UVA) J. Mazzarella, D. Frayer, T. Vavilkin, C. Bridge (IPAC) P. Appleton (IPAC), D. Sanders, J. Barnes, (IFA)

E N D
MIR Diagnostics and Molecular Gas in Local Luminous Infrared Galaxies Andreea Petric Collaborators: L. Armus, J. Howell, J. Surace (SSC/Caltech), A. Evans (UVA) J. Mazzarella, D. Frayer, T. Vavilkin, C. Bridge (IPAC) P. Appleton (IPAC), D. Sanders, J. Barnes, (IFA) J. Koda, N. Scoville (Caltech)
LIRGS dominate the cosmic infrared background and star formation activity between 0.5<z<1 (Elbaz et al. 2002). At L>1011.4L the space density of LIRGs exceeds that of optically selected galaxies and as such account for the majority of evolution in number counts and star-formation at z<1 (Le Floc’h et al. 2005, Caputi et al. 2006)
The Great Observatories All-sky LIRG Survey (GOALS) Spitzer Legacy Program-- targets 202 Luminous Infrared Galaxies (LIRGs; LIR[8-1000 μm] >1011 L) in the local (z<0.088) Universe selected from the IRAS Revised Bright Galaxy Sample (RBGS; Sanders et al. 2003). Data sets: HST, Spitzer, GALEX, Chandra, and optical and radio ground-based undergoing programs data CO and NIR high resolution spectroscopy. False colorimages of ten objects made from ACS F435W (blue) and F814W (red). These galaxies display the full range of morphologies along the merger sequence Armus et al. in prep.
Contribution of SB/AGN to the IR luminosity (I) 202 systems ->287 IRS spectra 5-34 microns in all the IRS spitzer modules 60 sources in the archive and a recent IRS-mapping proposal (PI Armus) Mid-infrared spectra in galaxies can arise from: 1.The evolved stellar population 2. The emission from the ionized interstellar gas 3. Nonthermal emission from radio sources 4.Dust particles responsible from very small grains and PAH Empirically the contribution of these can be disentangled. (Laurent et al. 2000, Rigoupoulou 2000, Genzel 2000, Armus 2004,2007)
Contribution of SB/AGN to the IR luminosity (II) Ratios of the fine-structure lines can be used to gauge the dominant ionizing source, (hot stars or AGN). Features such as the 14.3 [NeV] lines at 14.3 and 24.3 microns imply the presence of an AGN by their very detection in a galaxy spectrum since it takes 97.1 eV to ionize Ne 3+.
Comparison with ULIRGs For ULIRGs a strong correlation between IR luminosity and the contribution of the AGN to the total IR budget was observed (Desai et al. 2007). We do not have such a correlation. In ULIRGs 40% of the sources are dominated by AGN (Armus et al. 2004, 2007, Desai 2006, Farrah 2007) Comparatively only 18% of our sources have [NeV] detections and only 2% are AGN dominated. (Beware: Not all AGN show the [NeV] line e.g. Mrk 231 as shown in Armus et al. 2007) If LIRGs dominate the growth of galaxies at z ~1 and they have a relatively small AGN contribution this would suggest that either AGN is short timescale episodic phenomena (e.g. Osmer et al. 2004) or that the fraction of AGNs at z~1 is low.
49% of our sources appear to be involved in some level of major merger (where morphology of at least one of the galaxies within 40” separation) A survival analysis test suggests that LIRGs with low 6.2 PAH EW (<0.3) detections may be a different population than that of LIRGs with high (>0.3 EW) ->For LIRGs the importance of An AGN to the MIR energy budget is not strictly determined by the merger stage. -> Is our interpretation of the merger stage is incorrect-> need to look at cold gas
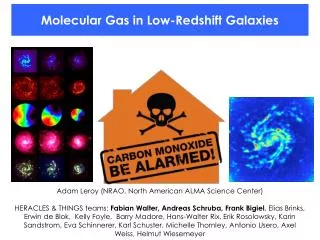
MIR-lines probe rotational transitions of warm molecular gas at temperatures between ~100->1000K We detect H2 (S0) in 64% of LIRGs,93% S(1), and 78% (S2) Comparatively only 3% of ULIRGs are detected in S(0)
Higher ratios of H2/IR in LIRGs than in ULIRGs. LIRGs with high ratios of H2/IR are also shown to exhibit strong Fe2 emission A high ratio (≥1) of [Fe II] to [OIV] is a shock indicator since shocks are needed to free Fe from the dust grains (Lutz et al. 2003).
Molecular gas in LIRGs 50 hrs with CARMA in D & C configurationto study 5 sources at 5” and 2” to map the CO distribution along a merging sequence of LIRGs to: * determine the IR/CO correlation thorought the galaxy disk as a function of merger stage, *Compare with IR spectroscopic indicators of star-formation as well as the spatial distribution of star-forming clusters. * Look at kinematics: 20km/sec resolution to look for non-circular motions (Petric et al. in prep)
What about the HI? Iono, Yun & Ho 2005 VLA image of II Zw096 : *blue and red contours show the HI distribution while the the green contours mark the the position of radio continuum at 21 cm Image courtesy of J. Hibbardand A. Evans A literature search indicates that only 65 LIRGs have been observed in HI and only about third of these have been observed with interferometers as observations require upwards of 20 hrs to achieve the resolution and sensitivity necessary to detect diffuse tail emission and the associated velocity structure.
HI-rogues gallery Hibbard, van Gorkom, Rupen & Schiminovich 2001 The NGC 5713/5719 System. VLA C-array, 30'' resolution
Determining the initial conditions, time and point of view of the merger Barnes & Hibbard AJ, 2009 IDENTIKIT can be used to determine the merger history of two interacting disk galaxies by finding the merger parameters which best reproduce its observed morphology and kinematics. .. > Need high sensitivity And resolution data which would be too timely to Obtain with the current VLA
HI Mapping Goals for EVLA (I) Complete the local HI/continuum survey of local LIRGs (z<0.3) to identify the age and geometry associated with their merger stage to determine 1. Does the luminosity of the high ionization lines change at different stages of merging. 2. Properties of the warm and cold molecular gas as a function of merging stage. 3. IR surface density as measured by IRAC and HST NICMOS to understand how the the efficiency of gas changes across the merging sequence. 4. Combine high resolution NIR spectroscopy (Petric et al. in prep) from which we can measure the rotation of the warm H2 with the high resolution HI from the EVLA to look for bulk motions of the cold gas associated with the merging process.
HI Mapping Goals for EVLA II Complement proposed high redshift HI surveys by EVLA and LOFAR with a survey of similar IR/L* luminosities galaxies at z ranging from 0.3 ->1. The 0.7->1 redshift range is where LIRGs start to dominate the IR number counts. EVLA’s both the ultrasensitive array and the New Mexico Array will be needed to study a statistical significant sample of sources in several redshift bins to study the evolution of merging properties as determined from the HI morphology and kinematics. Perform detailed dynamical modeling of disks to look for evidence of minor mergers as seen in the Donovan et al. contribution and model the gas dynamics.