Download
1 / 1
10 likes | 156 Views
The Galaxies and Cosmos Explorer Tool. Mary Kay Hemenway, Shardha Jogee, Sarah Miller, Aaron Smith, Achal Augustine, and Dan Lester (University of Texas at Austin).

E N D
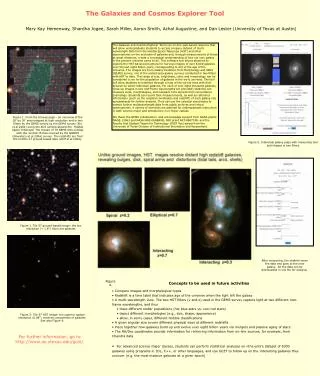
The Galaxies and Cosmos Explorer Tool Mary Kay Hemenway, Shardha Jogee, Sarah Miller, Aaron Smith, Achal Augustine, and Dan Lester (University of Texas at Austin) The Galaxies and Cosmos Explorer Tool is an on-line web-based resource that will allow undergraduate students to access a legacy dataset of multi-wavelength data from the Hubble Space Telescope (HST) and other observatories on the evolution of galaxies and, through measurements of those at great distances, create a conceptual understanding of how our own galaxy in the present universe came to be. This software tool allows students to explore the HST Advanced Camera for Surveys images of over 8,000 galaxies over the last eight billion years, corresponding to 2/3 of the age of the Universe. The images are from Galaxy Evolution from Morphology and SEDs (GEMS) survey, one of the widest-area galaxy surveys conducted in two filters with HST to date. The range of size, brightness, color, and morphology can be considered a zoo for the population of galaxies in the early universe. The tool will allow students to interface through a map of the survey area with their browser to select individual galaxies. For each of over eight thousand galaxies, close-up images in two rest-frame wavelengths are provided; students can measure sizes, morphologies, and lookback time derived from concordance cosmology. Students can record their measurements, as well as reference information (such as the celestial coordinates and redshift) of each galaxy into spreadsheets for further analysis. They can use the celestial coordinates to extract further multiwavelength data from public archives and virtual observatories. A variety of exercises are planned for undergraduate instruction in both science major and introductory non-major classes We thank the GEMS collaboration, and acknowledge support from NASA grants NAG5-13063 and NASA NNG 06GB99G, NSF grant AST-0607748, and the Faculty And Student Teams for Technology (FAST Tex) award from the University of Texas Division of Instructional Innovation and Assessment. Figure 1. From the browse page - an overview of the 30' by 30' area mapped at high resolution and in two filters by the GEMS survey by the GEMS survey (Rix et al 2004) using the ACS camera aboard the Hubble Space Telescope. The mosaic of 78 GEMS tiles overlap with the central 15 tiles covered by the GOODS (Giavalisco et al 2004) survey. The redshifts are from the Combo-17 ground-based data (Wolf et al 2004). Figure 5. Individual galaxy page with measuring tool and images in two filters. Figure 2. Tile 57 ground-based image: the low resolution (~ 1.8") blurs out galaxies After measuring, the student saves the data and goes to the next galaxy. All the data can be downloaded in one file for analysis. Figure 4. Concepts to be used in future activities • Compare images and morphological types • Redshift is a time label that indicates age of the universe when the light left the galaxy • A multi-wavelength view. The two HST filters (v and z) used in the GEMS survey capture light at two different rest-frame wavelengths, and thus • trace different stellar populations (hot blue stars vs. cool red stars) • depict different morphologies (e.g., size, shape, appearance) • allow, in some cases, different Hubble classifications • A given angular size covers different physical sizes at different redshifts. • Piece together how galaxies build up and evolve over eight billion years via mergers and passive aging of stars • The RA/Dec coordinates provide information for retrieving information from on-line sources, for example, from Chandra data • For advanced science major classes, students can perform statistical analyses on ハthe entire dataset of 8300 galaxies using programs in IDL, C++, or other languages, and use GCET to follow up on the interesting galaxies they uncover (e.g. the most massive galaxies at a given epoch) Figure 3: Tile 57 HST image: the superior spatial resolution (0.08") resolves components of galaxies. See also Figure 4. For further information, go to http://www.as.utexas.edu/gcet/