Download
1 / 2
20 likes | 154 Views
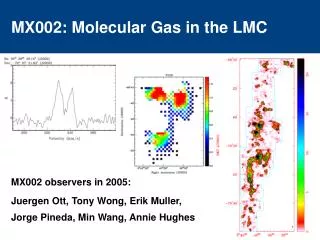
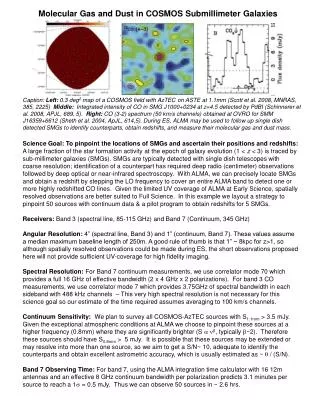
Molecular Gas and Dust in SMGs in COSMOS. Left panel is the COSMOS field with overlays of single-dish mm surveys. Right panel is a 0.3 sq degree map at 1.3mm (Scott et al.) During Early Science, ALMA may be used to follow up all of these sources to identify the counterparts. .

E N D
Molecular Gas and Dust inSMGs in COSMOS Left panel is the COSMOS field with overlays of single-dish mm surveys. Right panel is a 0.3 sq degree map at 1.3mm (Scott et al.) During Early Science, ALMA may be used to follow up all of these sources to identify the counterparts. Science Goal: To pinpoint the locations of SMGs in the COSMOS field and to ascertain their positions and redshifts: A large fraction of the star formation activity at the epoch of galaxy evolution (1 < z < 3) is traced by submillimeter galaxies. Usually these galaxies are detected using single dish telescopes which have coarse resolution. Identification of a counterpart has been done using deep radio (centimeter) observations followed by deep optical or near-infrared spectroscopy. With ALMA, we can not only identify these sources at the same wavelengths but also obtain a redshift by stepping the LO frequency to cover an entire band to detect one or more highly redshifted CO lines. In principle, one could also aim to spatially resolve these galaxies but given the limited UV coverage, detailed spatially resolved observations may be better done at Full Science. Receivers: Band 3 (spectral line, 85-115 GHz) and Band 7 (Continuum, 345 GHz) Angular Resolution:4” (spectral line, Band 3) and 1” (continuum, Band 7). These values assuming a median baseline of 250m. Longer baselines would be better. A good rule of thumb for high redshift observations is that 1” ~ 8kpc for z>1. Galaxies span a wide range of sizes and therefore spatially resolved observations are possible during ES but UV-coverage may not provide sufficient image fidelity. Spectral Resolution:For the Band 9 measurements, each measurement will use the full continuum effective bandwidth of 16 GHz (2 x 3.75 GHz x 2 polarizations). For band 3 measurements, we will also use the full (2 x 3.75 GHz) bandwidth for redshift determination. The nominal spectral resolution in that mode is 0.5 Mhz (~1.7 km/s at 3mm) which can be averaged to 50 or 100km/s for the purposes of science described here. However, the data rate for this mode may be prohibitively large - users are encouraged to examine this carefully. Continuum Sensitivity: Suppose we want to survey all sources detected with AzTEC. Although AzTEC observed at 1.3mm, the exception atmospheric conditions for ALMA allow us to observe these at a higher frequency (0.8mm) where the sources are significantly brighter (nb). Typically b~2 and therefore we gain in S/N in Band 7 even with slightly higher system temperatures. Here we aim to observe all sources with S0.8mm = 1 mJy at at least a S/N > 5. The goal is to identify the counterparts and astrometric accuracy ~q/ (S/N) Observing Time: Using the ALMA integration time calculator with 16 12 m antennas and a total of 8 GHz continuum bandwidth per polarization requires 3 minutes per source. Thus we can observe 50 sources in ~1.5 hrs but this does NOT include the overheads in the system which are not yet well known. Experience from other observatories suggests that we may need 30-50% more time in total to complete this project.
Spectral Line Sensitivity: Since most bright SMGs (S0.8mm > 5 mJy) have an integrated CO flux ~ 1—4 Jy km/s, we assume we want to detect a source in a 100 km/s channel with a signal of ~5 mJy at a 100 GhzThus we aim to reach 1 mJy in 100 km/s channel in Band 3. Observing Time: For Band 3, this results in a integration time requirement of 8.6 minutes. To cover the entire Band 3 frequency range requires setting the LO at at least 4 (and maybe 5) frequencies, namely 92, 96, 100, 104 and 108 GHz. Thus each galaxy requires ~43 minutes of integration time. In the future:50 antennas will significantly decrease the time for the blind redshift searches as described above to ~1 minute per LO setting and provide the instantaneous UV coverage needed to map the galaxies. However to do large surveys of galaxies, known redshifts will significantly improve the efficiency of observations. Also note that at very highest redshifts (z > 6), Band 3 will be observing CO lines higher than J=7->6 which may not be as bright as the lower CO lines. Place holder for real OT screen capture.