Download
1 / 20
200 likes | 314 Views
Aquarius/SAC-D Salinity Satellite Mission and the Ocean Observing System. NOAA/CPO Climate Observation Division 6th Annual System Review 3-5 September 2008 Silver Spring, MD. Gary Lagerloef Aquarius Principal Investigator. AQUARIUS/SAC-D Science Workshop Puerto Madryn, Argentina,

E N D
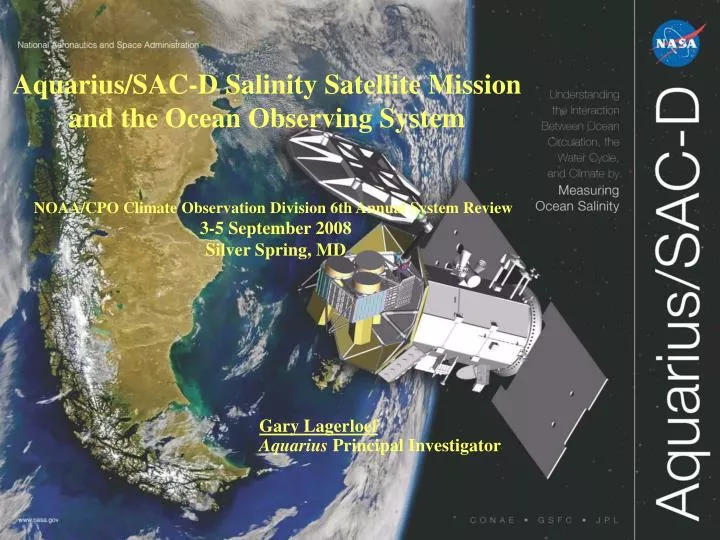
Aquarius/SAC-D Salinity Satellite Mission and the Ocean Observing System NOAA/CPO Climate Observation Division 6th Annual System Review 3-5 September 2008 Silver Spring, MD Gary Lagerloef Aquarius Principal Investigator
AQUARIUS/SAC-DScience Workshop Puerto Madryn, Argentina, 3-6 December 2008 Oceanography, Vol. 21, No. 1
Aquarius/SAC-D Observatory International Partnership between United States – Argentina • Service Platform and SAC-D Science Instruments • Mission Operations & Ground System • Aquarius Salinity Microwave Instrument • Launch Vehicle
3 beams390 km wide swath. 76 x 94 km 96 x 156 km 84 x 120 km Mission Design and Sampling Strategy Sun-synchronous exact repeat orbit 6pm ascending node Altitude 657 km • Global Coverage in 7 Days • 4 Repeat Cycles per Month Beams point toward the night side to avoid sun glint In Orbit Checkout Surface Validation Aquarius Ground System Salinity Data 150km, Monthly, 0.2 (pss) Launch 22 May 2010
Basin scale spatial resolution provided by the Aquarius footprint: • Top: Snapshot of a 1/8 degree OGCM SSS field. • Middle: The same field with a 150 km Gaussian filter applied to simulate the Aquarius spatial resolution, removing much of the eddy scale structure while preserving good spatial resolution of basin and gyre scale structures. • Bottom: Mean annual SSS from World Ocean Atlas 2005.
SSS 30-day Retrieval Simulation • Representing both ascending and descending at Aquarius 3 horn footprints 30 day mean Input SSS field 30 day men Retrieved SSS field
SSS Retrieval Simulation Mean and Standard Deviation Errors • Representing both ascending and descending of all 3 horns 30 day SSS retrieval bias 30 day SSS retrieval error standard deviation Note degradation in high latitudes, especially southern ocean
Breakdown of Simulated Retrieval Errors by Latitude Band Individual 5.6 second sample standard deviation error <0.15 psu While these simulator results look very promising, we a certain to have overlooked something… Mean bias error Zonal mean SST Frank Wentz and Sab Kim, Remote Sensing Systems; Aquarius Algorithm Development Team
U.S. CLIVAR Salinity Working Group Proposed Control Volume Experiment Constrain the complete surface atmosphere/ocean hydrologic [seasonal] cycle based on observations Test and improve coupled climate models • Alternative regimes • evaporative subtropical gyre • high precipitation tropical regime Oceanography, Vol. 21, 2007
26 N Potential Process Study in 2011 Air-Sea Freshwater Budget Study Discussion group meeting at WHOI 9-10 July 2008: Ray Schmitt, Eric Lindstrom, Steve Riser, Arnold Gordon, Bill Large, Jim Carton, Fred Bingham, Gary Lagerloef, Lisan Yu, David Fratantoni • Location advantages: • Weak horizontal divergence • Low precipitation 1D physics • Modest eddy activity • Source of water for northern tropical thermocline • Stable SSS for satellite Cal-Val • Warm SST (better for Aquarius accuracy) • Leverages other resources: RAPID/MOC sections, Pirata Array, ESTOC time series (Canary Islands) • Logistically tractable
Circulation Convergence Zone and Weak Advection
Water vapor to the Pacific across central america Wind stress curl Trade winds Westerlies Florida Straits Arnold. Gordon North Atlantic Salinity Maximum Science Questions: What processes maintain the salinity maximum? Where does the excess salt go? What processes give rise to temporal variability? What is the larger impact on the shallow overturning circulation?
GOSUD Aquarius and Integrated In Situ Observations Surface Validation Integrated Satellite + in situ Salinity Observing System
U.S. CLIVAR Salinity Working Group Recommendations - 2007 • In response to limitations of the historical observing system we support the maintenance and expansion of the current in situ observing system, especially Argo and the Volunteer Observing Ship thermosalinographs. • We recommend enhancements to the global observing system specifically directed towards improved estimation of sea surface salinity: • Expand the Argo instrument suite to include Surface Argo Salinity Measurements (Upper 5-m sensor) to allow a more precise calibration of Aquarius. (Skin depth ~2 cm) • Support development and testing of sea surface salinity sensors for deployment on the surface drifters of the Global Drifter Program.
TAO Buoy 2S 165E 0.2 psu Delcroix & McPhaden, JGR 2002) TAO Array SSS
Applying TSG Data for Understanding Calibration The RMS difference between satellite and in situ data comprises several terms: εOis an error due to the spatial offset between the satellite and in situ samples (~0.2 psu; likely to be the largest term). εPis thedifference error between a point salinity measurement and the area average over the instantaneous satellite footprint (log-normal distribution, median ~0.05 psu, extremes ~0.5). εZis the difference error between the skin depth (~1-2 cm) salinity and in situ instrument measurement generally at 0.5 m to 5 m depth (can be >1 psu in rain). εCis the in situ sensor calibration error, usually very small (<0.05 psu) Provided by Gary Lagerloef and John Gunn
Argo Enhanced SSS Float Trials Purpose: To obtain “skin” salinity and upper 5m gradient statistics • Argo CTD nominally shuts off at ~5m • Steve Riser and Gary Lagerloef are assembling experimental Argo floats each with a secondary CTD sensor to profile to the surface. The primary CTD will shut off at ~5 m per normal operations. • Sea-Bird developed a specialized “Surface Temperature Salinity” (STS) sensor which is programmed to profile the upper ~30 m and is inter-calibrated with the primary CTD • We deployed the first at the HOT site near Hawaii late summer 2007. • Others are being deployed in the equatorial Pacific in 2008, including one in the warm pool. • Development of at least 20 are being funded by NASA during the next 2 years.
9-month drifts <~0.06 Apr Jun Aug-Sep Dec Drifters SSS: COSMOS 2005 Field Test, Bay of Biscay Reverdin et al., JTech, 2007 SVP Drifters Ready for more extensive SSS trials Parallel effort at WHOI
Priorities for Aquarius SSS Cal/Val and Ocean Process Studies 50-100 SSS Drifters in the N. Atlantic Subtropical gyre by 2011. ~50 Enhanced STS Argo in high rainfall and high evaporation regimes. ~50 SSS Drifters in the Southern Ocean (large satellite error)
Aquarius/SAC-D Science Team Announcements • A process is underway between NASA and CONAE to coordinate the selection process to form a joint mission science team to support both Aquarius salinity and the other SAC-D science instruments and objectives. • US submissions are mainly through NASA ROSES, "Ocean Salinity Science Team" . Proposals are due in 18 March 2009; Notices of Intent due 16 January 2009. • The next Aquarius/SAC-D science workshop is in Puerto Madryn Argentina, 3-5 December 2008. Abstract deadline 10 October 2008 • Fall AGU Special Session OS24: Climatic Variability in the Marine Freshwater Cycle; Abstracts due 10 September 2008