Download
1 / 42
420 likes | 564 Views
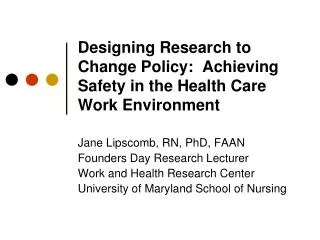
Designing Research to Change Policy: Achieving Safety in the Health Care Work Environment. Jane Lipscomb, RN, PhD, FAAN Founders Day Research Lecturer Work and Health Research Center University of Maryland School of Nursing. Acknowledgements:. Work and Health Research Center

E N D
Designing Research to Change Policy: Achieving Safety in the Health Care Work Environment Jane Lipscomb, RN, PhD, FAAN Founders Day Research Lecturer Work and Health Research Center University of Maryland School of Nursing
Acknowledgements: • Work and Health Research Center • Jeanne Geiger Brown • Jeff Johnson • Joan Kanner • Kate McPhaul • Carla Storr • Alison Trinkoff • Matt London, NYS PEF • Earl Dotter, Photo Journalist
Our Partnerships • NY • PEF, CSEA, NYSCOPBA (labor unions) • OMH, OASAS, OCFS, DOL (state government) • ARI (architectural consultant) • WA • 1199 NW/SEIU (labor) • IL • UIC • IL/IN HC/SEIU (labor) • Addus Health Care
The Burden of Work-Related Illness and Injury • 6,500 job-related deaths from injury/yr • 13.2 million nonfatal injuries/yr • 60,300 deaths from disease/yr • 862,200 illnesses/yr • $171 billion Leigh JP, Arch Intern Med. 1997
Incidence Rates of Nonfatal Occupational InjuriesHCSA sector and private industry, 2003-2006
Incidence Rates of Nonfatal Occupational IllnessesHCSA sector and private industry, 2003-2006
Incidence Rates of Nonfatal Occupational Injuries and IllnessesHCSA subsectors and private industry, 2003-2006
Link Between Work Environment and Patient Safety (IOM Report, 2004)
Onerous Nurse Workloads and Chaotic Environments: Errors Waiting to Happen L. Aiken, Univ. of Pennsylvania
Two Case Studies: Research Designed to Change Policy • Evaluation of Workplace Violence Prevention Interventions in Social Service Settings (R01-OH007948 ) • Blood Exposure and Primary Prevention in the Home Care Workplace (R01-OH008237)
CDC/NIOSH Definition(CDC/NIOSH Current Intelligence Bulletin, 1996) Workplace violence: violent acts,including physical assaults and threats of assault, directed toward persons at work or on duty
Facts about Workplace Violence: • 3rd leading cause of death in the workplace • NCVS – Over 1.7 million assaults on working people annually(mental health workers’ risk is nearly 4x that of all HCW) • In 2002, 43% of all non-fatal assaults on workers which resulted in lost work days occurred in the healthcare sector • Healthcare patients commit 48% of all non fatal attacks in the workplace
“Iceberg” of Workplace Violence Lost-time Work Injury Injury Assault Threat w/Weapon Threat of Assault VerbalHostility/Bullying Fear/Anxiety Stress/Vigilance
Magnitude of the Problem NCVS – 1.7 million assaults on working people annually (Duhart, 2002) 60% of non-fatal assaults resulting in lost work days occurred in the healthcare sector (BLS, 2007) Up to 100% of staff report verbal and/or physical assault/year in acute care, varying by setting (Bensley 1997, May 2002)
Ave. Annual Rate of AssaultSelected OccupationsNational Crime Victims Survey, US DOJ 2001
Violence and the Mentally Ill Attributable risk – 3-5% Violence independently correlated with several factors among mentally ill Hx of victim of violence, Homelessness Poor medical health Sx of mental illness rather than the Dx
Risk factors for violence in health care? Client Factors: Under the influence of drugs or alcohol History of violence certain psychotic diagnosis Access to firearms Staffing Factors: Working alone Working when understaffed Lack of staff training Lack of policies for preventing and managing crises Environmental Factors: Poor environmental design Inadequate security, lighting Unrestricted movement of the public
Literature Review:Intervention Evaluation Training Lehman (1983) VA Hospital + Infantino & Musingo (1985) + Carmel and Hunter (1990) - Parks (1996) - Goodridge et. Al. (1997) + Post-incidence debriefing Flannery et.al. (1998) + Matthews (1998) -
Literature Review:Intervention Evaluation Other strategies Drummond et. Al. (1989) - + Hunter& Love (1996) + Arnetz & Arnetz (2000) - Comprehensive Program Lipscomb et al. (2006) +/- Policy/Regulation Peek-Asa et al. (2007) +/-
ATC Patients’ Profiles 2003-2004 • 33% criminal justice history • 40% homeless • 34%/80% mental health history • 79% 2nd substance abuse
Environmental Survey Checklist (Murrett, ARI) • Working in isolation, hidden areas • Surveillance cameras, mirrors, view panels • Access control • Security hardware, alarm systems • Crowding • Recreation areas • Lighting, noise • Objects/furnishings as weapons • Sharp edges, hard surfaces
Staff Focus Groups: Findings • Staffing, especially evenings • Food – poor quality causes tension • Intake – can stress out clients • Need more info on clients’ histories • Fights over phones and personal items • Building complaints, crowding, layout • Patients w/ MH issues: staff training; # of MH providers
Staff Survey Findings (N=355) • 68% report that patients threaten staff at least a few times/month • 52% report that they defuse potential violence at least a few times/month • 21% say they aid a co-worker being threatened at least a few times/month • 1% say they are hit at least a few times/month
Staff Survey Findings (N=355) • 51% say they often or always review the patient history at first visit • 71% say they often or always are clear about what procedures to follow when they face potential violence • 76% report they completed VIP training in past year
Staff Survey Findings (N=355) • Staff assaults were significantly associated with: • High risk profile of patient population: OR = 1.25 (95% CI- 1.05, 1.48) • “Having a clear procedure for clients to make their concerns known to staff” OR = 0.54 (95% CI- 0.31, 0.94) • Violence prevention strategies explained 17% of the variance in verbal aggression; while the direct care environment contributed an additional 3%.
NYS Violence Standard All public employers must evaluate their workplaces to identify violence-related risk factors Union reps and employees must be included Key program elements Incident reporting and recordkeeping List of risk factors Risk-reduction measures Training Must be in writing if have >20 employees Enacted June 2006
Case Study – Marty SmithMurdered by client while on a home visit • 46 year old experienced Social Worker • Employer: Non-profit mental health services provider • Service: Mental Health Crisis Intervention • Environment: Clients’ homes • Clients: Mentally ill living at home • Union: SEIU NW1199
….and Accompanied Visits • “I'm quite sure the supervisor would have accompanied me, …I know that but I also know that for her to come with me it's an hour out it's an hour there and it's an hour back and then if she has a meeting and she can't come when I come that's a hassle, you know.”
The Marty Smith Act (2007) will: • provide annual safety training for all community mental health workers; • ensure that crisis intervention workers will not have to go out alone on high-risk home visits; • ensure better access to case files for situations that might be dangerous.
Two Case Studies: Research Designed to Change Policy • Evaluation of Workplace Violence Prevention Interventions in Social Service Settings (R01-OH007948 ) • Blood Exposure and Primary Prevention in the Home Care Workplace (R01-OH008237)
Occupational Groups of Healthcare Workers Exposed to Blood/Body Fluids(CDC NaSH 6/95-12/01)
Percent reduction in needlestick injuries for major safety device categories EPINet Centers for Disease Control and Prevention Up to 88% 76% 66% % reduction in injuries 23% IV Needless Systems Self-blunting phlebotomy needle Phlebotomy needle with add-on safety feature Winged steel blood collection needle with sliding sheath
Decline in HBV Cases Among Healthcare Workers Following Vaccination 17,000 OSHA mandates HBV vaccination 800 This regulation had the greatest impact in eliminating HBV transmission among healthcare workers. Mahoney F et al. Archives of Int Med 157 (1997): 2601-2603
Blood Contact Rates* among RNs (N=794) and PCAs (N=980) providing care in the home PCA RN Sharps 3.8 12.6 Non-sharps 6.0 16.3 Any BBP exposure 8.1 26.7 * (injury per 100 FTE) Compared with a rate of 16/100 FTE among hospital-based RNs (Trinkoff et al, 2007)
Typical job activities and exposure to blood Odds Ratio (95% CI) RN PCA Change dirty linens 1.7 (1.2, 2.4) 1.6 (0.7, 3.4) Handle sharps 1.4 (0.9, 3.2) 7.4 (4.1, 13.3) Change wound dressings 2.5 (1.6, 4.1) 6.3 (3.4, 11.6) Empty wound dressings 2.1 (1.4, 3.1) 8.5 (4.0, 18.0) Insert/care urinary catheter 1.6 (1.1, 2.3) 6.9 (3.0, 15.7) Colostomy care 1.6 (1.2, 2.4) 4.9 (2.1, 11.2)
OSHA BBP Standard (1991/2000) “applies to all employers who have employees with reasonably anticipated exposure to blood and other potentially infectious materials” Should this standard apply to unlicensed health care personnel providing care in the home?