Download
1 / 8
120 likes | 578 Views
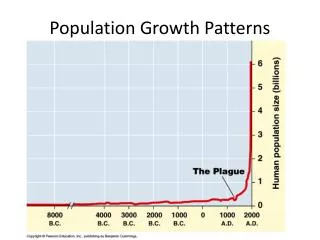
Population Growth Patterns. Population Size Factors. Population sizes change based on resources Increase Immigration Births Decrease Emigration Deaths. Exponential Growth. Growth rates determined by abundant resources Dramatic population increases over time J-shaped curve.

E N D
Population Size Factors • Population sizes change based on resources • Increase • Immigration • Births • Decrease • Emigration • Deaths
Exponential Growth • Growth rates determined by abundant resources • Dramatic population increases over time • J-shaped curve
Logistic Growth • Most populations faced with limited resources • Factors: Disease, food, predators, climate, space, mates • Three stages • 1) Slow growth • 2) Exponential growth • 3) Carrying Capacity: greatest number of individuals that a population can sustain • S-shaped curve
Population Crash • Defined: Dramatic decline in the size of a population • Usually over a short time period • Causes: Environment changes, drop in resources
Limiting Factors • Density Dependent: factors that are affected by the individuals in a given area • Competition • Predation • Parasitism • Disease • Density Independent: environmental factors that limit populations • Climate/weather • Natural disasters • Human activity
Density Dependent • Top graph: Two species of Paramecia were grown in two separate containers. Both populations thrived. • Bottom graph: Due to competition, Paramecium caudatumcrashed when grown in the presence of Paramecium aurelia
Density Independent This graph shows the decline in the population of one of Darwin's finches on Daphne Major, a tiny (100-acre) member of the Galapagos Islands. The decline (from 1400 to 200 individuals) occurred because of a severe drought that reduced the quantity of seeds on which this species feeds. The drought ended in 1978, but even with ample food once again available the finch population recovered only slowly.