Download
1 / 1
10 likes | 122 Views
AUDITORY EVOKED POTENTIALS IN THE SITUATION OF ATTENTION IN RELATION TO PECULIARITIES OF TEMPERAMENT IN MAN Chernysheva E.G., Chernyshev B.V. Ramendik D.M., Osokina E.S., Bezsonova V.E., Zinchenko V.P.

E N D
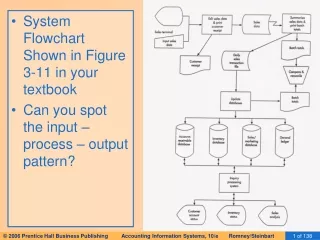
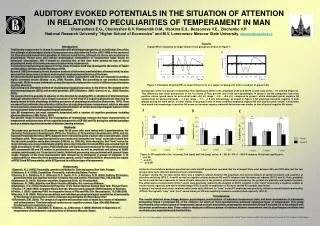
AUDITORY EVOKED POTENTIALS IN THE SITUATION OF ATTENTIONIN RELATION TO PECULIARITIES OF TEMPERAMENT IN MAN Chernysheva E.G., Chernyshev B.V. Ramendik D.M., Osokina E.S., Bezsonova V.E., Zinchenko V.P. National Research University "Higher School of Economics" and M.V. Lomonosov Moscow State University, echernysheva@hse.ru Results Typical EPs in response to target stimuli in two groups are shown in Figure 1. Introduction Traditionally temperament is viewed in connection with physiological properties of an individual. One of the first attempts of physiological study of temperament was undertaken by Pavlov (1951-1952) in the context of his theoretical and experimental paradigm of classical conditioning. Although his theory was positioned as physiological, Pavlov gave only indirect physiological interpretation of temperament types based on behavioral observations. Still it should be admitted that at that time there existed no way of direct physiological study of the brain processes that determine temperament. A similar psychophysiological approach to the study of human mind was developed in the works of Teplov and Nebylitsyn (Golubeva, 2005; Nebylitsyn, 1972). Eysenck (1982) developed a theory based on analysis of behavioral manifestations of human mind; he also assumed that temperament is based on biological and physiological features of the brain. All abovementioned questionnaires are based on similar assumptions and thus are expected to produce highly correlated results (Strelau et al., 2009; Rusalov, 2000). But according to our previous research (Ramendik, 2008) for some individuals strong discrepancies between the results of different questionnaires could be observed. A promising and affordable method of studying physiological processes in the brain is the analysis of the electroencephalogram (EEG) and evoked potentials (EP) (Golubeva, 2005; Gurrera et al., 2005; Rusalov, 2000). We assume that it is possible to advance in this direction by studying EPs in situations of attentional load. Although attention itself is not a simple construct, it is the kind of a cognitive phenomenon that may be deeply rooted in brain physiology including processes of physiological activation (Kahneman, 1973). Thus we expect that individual characteristics of attention strongly depend upon temperament, which is assumed to be essentially a behavioral and psychological manifestation of certain basic physiological features of the nervous system (also including physiological activation). Late EP components are most commonly associated with a number of cognitive processes including attention (Naatanen, 1992; Polich, 2007). The present study is devoted to the investigation of relationships between the basic characteristics of temperament and parameters of late cognitive components of EP (N2 and P3) during the odd-ball paradigm used as a simple experimental model of situation, loading attention. Figure 1: Examples of typical EPs to target stimuli in Cz in a subject of group I (A) and in a subject of group II (B). Comparison of the two groups revealed that they significantly differ in the amplitude of N2 and N2-P3 in both easy series – 1st and 3rd (Figure 2). This difference was most pronounced in the 1st series (T-Test, p=0.001 and 0.003 correspondingly). In group II the N2 component had more positive values (grand mean for pericentral leads +3.0 μV, range – -0.5 – +6.4 μV), compared to group I, which displayed typical negative N2 (grand mean for pericentral leads – -1.2 μV, range – -7.1 – +1.5 μV). Interestingly, as shown in Figure 2, N2 amplitude becomes negative in both groups during the hard series. In other words, only group II only in easy condition displayed atypical N2 with positive peak values. It should be also noted that morphology of positive N2 waves as transient negative potential deflections was similar to that of typical negative N2 waves. Methods The study was performed in 22 subjects aged 18–20 years who were tested with 3 questionnaires: the Pavlovian Temperament Questionnaire (PTS), the Structure of Temperament Questionnaire (STQ) and the Eysenck Personality Inventory (EPI). Subjects were instructed to press a button after a rare stimulus, which had higher pitch. Three experimental series were conducted: during the two "easy" series (the 1st and 3rd) the two tones could be easily discriminated (1050 Hz vs. 1000 Hz), while during the 2nd "hard" series the target stimulus was chosen individually slightly above discrimination threshold. EEG was recorded from 32 leads according to 10-10% system. Peak amplitudes and latencies were measured for late evoked potential (EP) components N2 and P3 relative to prestimulus zero line, as well as amplitude and latency of N2-P3 complex peak-to-peak (on 15 pericentral leads). Statistical processing was performed with general linear model. Analysis of the three questionnaire data allowed us to distinguish 2 groups of subjects: I) 15 subjects (68%) in whom the three questionnaires agreed, and II) 7 subjects (32%) in whom only the results of FCB-TI and EPI were similar, while STQ pointed to a different type of temperament. Figure 2: EP amplitude in the 1st (easy), 2nd (hard) and 3rd (easy) series. A – N2; B – P3; C – N2-P3 complex. Statistical significance: * - p<0.05, ** - p<0.01,*** - p<0.001 References 1.Eysenck, H. J. (1982). Personality, genetics and behavior: Selected papers. New York: Praeger. 2.Golubeva, E. A. (2005). Capabilities. Personality. Individuality.Dubna: Feniks+ . 3.Gurrera, R. J., Salisbury, D. F., O'Donnell, B. F., Nestor, P. G., & McCarley, R. W. (2005). Auditory P3 indexes personality traits and cognitive function in healthy men and women. Psychiatry Res.,133, 215–228. 4.Kahneman, D. (1973). Attention and effort. Englewood Cliffs, NJ: Prentice-Hall. 5.Naatanen, R. (1992). Attention and Brain Function. Hillsdale, NJ: Lawrence Erlbaum. 6.Nebylitsyn, V. D. (1972). Fundamental Properties of the Human Nervous System. New York: Plenum Press. 7.Pavlov, I. P. (1951-1952). Complete Works, 2nd edn, Moscow and Leningrad: SSSR Academy of Sciences. 8.Polich, J. (2007). Updating P300: An integrative theory of P3a and P3b. Clin. Neurophysiol., 11, 2128–2148. 9.Rusalov, V. M. (2000). Natural preconditions and individual-psychophysiological peculiarities of personality. In Psychology of personality in works of Russian psychologists. St.-Petersburg: Piter. 10.Ramendik, D.M. (2008). The complex of cognitive and personal traits of adults as a means of adaptation and self-realization. Third international conference on cognitive science, 2 (pp. 434–425) Moscow: Khudozhestvenno-izdatelskiy centr. 11.Strelau, J., Mitina, O., Zawadzki, B., Babaeva, Ju., & Menchuk, T. (2009). Methods of diagnostics of temperament (formal-dynamic characteristics of behavior). Moscow: Smysl. Analysis of correlations between questionnaire data and EP parameters revealed that the strongest links exist between EPs and STQ data, but the two groups show quite different patterns of such relationships. In group I during the 1st easy series there was a negative relation between N2 amplitude and several indexes of speed of actions and easiness of attention switching (STQ 3, 4 and 6) as well as negative relation between N2 and P3 latencies and the same set indexes (STQ 3 and 5). Thus, probably, the faster and the less expensive in terms of brain resources is the process of information processing, the greater are plasticity and speed of actions. The dimensions of emotionality (STQ 7 and 8) were positively related to the duration of N2-P3 complex. In the "hard" series only a negative relation of social-related ergonicity and social-related tempo (STQ 2 and 6) to amplitudes of P3 wave and N2-P2 complex was found. In group II we found much fewer relations which were quite different. In "easy" series P3 amplitude was positively related to social-related emotionality (STQ 8). During both “easy” and “hard” series latency of N2 was negatively related to social-related ergonicity (STQ 2). Conclusions The results obtained show linkage between psychological manifestations of individual temperament traits and brain mechanisms of information processing. Group I comprised 2/3 of the subjects, for whom all three questionnaires produced congruous types of temperament. This group manifested a clear unitary system of temperament, based on brain mechanisms of perception and attention. Group II included 1/3 of the subjects with discordant questionnaire data. These subjects displayed a different picture of relations between temperament and its physiological correlates had much less clear organization and manifestation. This study comprises research findings from the "Psychophysiological study of attention and it's relation to characteristics of temperament by recording electrical brain activity" Project carried out within The Higher School of Economics’ 2011 Academic Fund Program