Predicting Packet Reception in Wireless Links: Modeling and Clustering Analysis
Explore the spatiotemporal variation in wireless links and propose a model to predict packet reception based on factors like interference, attenuation, and environmental conditions. Investigate link quality clustering and history bit vector transitions to understand link behavior fluctuations. Experimental methodology and results on network setups provide valuable insights for future work.

Predicting Packet Reception in Wireless Links: Modeling and Clustering Analysis
E N D
Presentation Transcript
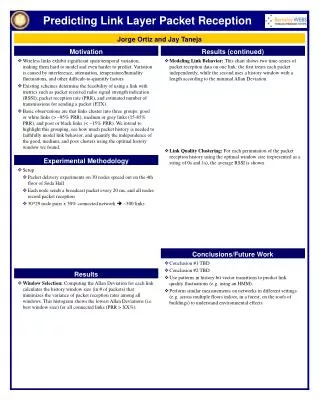
Predicting Link Layer Packet Reception Jorge Ortiz and Jay Taneja Motivation Results (continued) • Wireless links exhibit significant spatiotemporal variation, making them hard to model and even harder to predict. Variation is caused by interference, attenuation, temperature/humidity fluctuations, and other difficult-to-quantify factors. • Existing schemes determine the feasibility of using a link with metrics such as packet received radio signal strength indication (RSSI), packet reception rate (PRR), and estimated number of transmissions for sending a packet (ETX). • Basic observations are that links cluster into three groups: good or white links (> ~85% PRR), medium or grey links (15-85% PRR), and poor or black links (< ~15% PRR). We intend to highlight this grouping, see how much packet history is needed to faithfully model link behavior, and quantify the independence of the good, medium, and poor clusters using the optimal history window we found. • Modeling Link Behavior: This chart shows two time-series of packet reception data on one link: the first treats each packet independently, while the second uses a history window with a length according to the minimal Allan Deviation. • Link Quality Clustering: For each permutation of the packet reception history using the optimal window size (represented as a string of 0s and 1s), the average RSSI is shown. Experimental Methodology • Setup • Packet delivery experiments on 30 nodes spread out on the 4th floor of Soda Hall • Each node sends a broadcast packet every 20 ms, and all nodes record packet reception • 30*29 node pairs x 30% connected network~300 links Conclusions/Future Work • Conclusion #1 TBD • Conclusion #2 TBD • Use patterns in history bit vector transitions to predict link quality fluctuations (e.g. using an HMM). • Perform similar measurements on networks in different settings (e.g. across multiple floors indoor, in a forest, on the roofs of buildings) to understand environmental effects Results • Window Selection: Computing the Allan Deviation for each link calculates the history window size (in # of packets) that minimizes the variance of packet reception rates among all windows. This histogram shows the lowest Allan Deviations (i.e. best window size) for all connected links (PRR > XX%).