Download
1 / 25
250 likes | 329 Views
XIS QE Degradation in Orbit XIS Review2006 Mar 10. K. Hayashida, E.Miller, N. Anabuki, S. Katsuda, K. Torii, H. Tsunemi (Osaka Univ), H. Matsumoto (Kyoto Univ.), A.Bamba (Riken), M. Kokubun (Tokyo Univ.) and the SUZAKU XIS team. Outline of the Problem Findings.

E N D
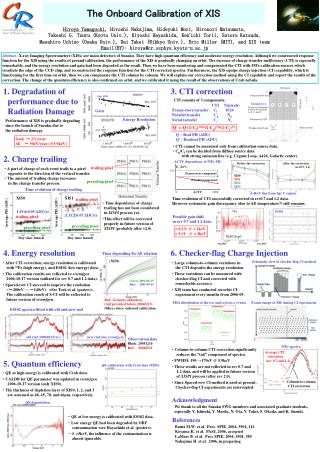
XIS QE Degradation in OrbitXIS Review2006 Mar 10 K. Hayashida, E.Miller, N. Anabuki, S. Katsuda, K. Torii, H. Tsunemi (Osaka Univ), H. Matsumoto (Kyoto Univ.), A.Bamba (Riken), M. Kokubun (Tokyo Univ.) and the SUZAKU XIS team
Outline of the Problem Findings • Some of the observed spectra at low energy (<1keV) were not what we expected • According to the knowledge from previous missions. • Inconsistent among the XIS 4 sensors • QE degradation at low energy is explained by introducing extra carbon absorber in the XIS response (~2005Dec). Contamination is most likely cause. • We performed repeated observations of one source (E0102). Evolution of the QE degradation was found. • XIS response in which extra carbon absorber was prepared and distributed to SWG members and GOs, with empirical model of its time evolution. • Analysis of diffuse sources indicated nonuniformity of the carbon absorber within XIS FOV. Contamination on OBF is most likely cause. • Analysis of atmospheric fluorescent line provided further data for time evolution and nonuniformity. • Detailed spectrum analysis of some sources provided information on the composition of the absorber.
(Assumed) Incident X-ray Spectrum from an Object XIS Hardware X-ray intensity Frame Data Object Energy Observed X-ray Spectrum Convolved with XIS Response Data Processing Onboard DE & Ground • Dark-level Subtraction • Event Extraction • Pulse Height (PHA) construction Counts/sec/keV PHA
RXJ1856.5-3754 Discovered with ROSAT Nearby (D~120pc) Isolated Neutron Star X-ray spectrum is fitted with a simple blackbody ( against NS atmosphere model). R~4-5km Quark Star ?
RXJ1856 Observed with Suzaku 2005-10/24~26RMF 20051210 a-d for XIS1 Rev0.3 data -10eV offset C-K edge ~0.3keV a: Based Cal on the Ground b: a x excess0.15mmC c: Dead Layer =Design Value d: c x excess0.15mmC
Suzaku/XIS ContaminationMeasurements with E0102 • E0102: SNR in SMC, bright in soft X-ray lines • excellent calibrator for low-E gain, QE changes • contamination degrading low-E eff. area of all XIS’s • model • thermal bremss + 24 Gaussian emission lines • Galactic + SMC absorption • pure C absorption from contaminant (varabs) • gain shift -5 eV ~ -15 ev • r2 ~ 1.6 (FIs) to 2.5 (BI) NeIX OVIII NeX MgXI OVII 2005-08-13 2005-08-31 2005-12-16 2006-01-17 2006-02-02
XIS Contamination Rate • empirical correction for observers • contamination rate turnover (?) • SMC NH uncertainty systematic error ±0.02 m independent of epoch change in effective C column: chip slope intercept (1016 cm-2/day) XIS0 1.6 ±0.1 4.4 ±4.0 XIS1 2.7 ±0.1 -9.6 ±15 XIS2 3.1 ±0.1 -3.2 ±14 XIS3 4.1 ±0.5 54. ±50.
Cyg Loop • Nearby Old Super Nova Remnant • 2005Nov 4pointgs C-band CVI-band
C-band/CVI-band map in detector coordinate =Inidicating absorber thickness is not uniform
Center Rim C Absorber thickness is about 1/2 at Rim (2005 Nov)
Atmospheric Fluorescence Line • When the telescope is looking at the shining Earth or its atmosphere, fluorescence lines of the Earth atmosphere (N-K, O-K) by Solar X-rays are contaminated in the observed spectra. • Intensity and line ratio depends on the elevation angle from the Earth rim and the Solar activity. N-K (0.39keV) O-K (0.52keV) DAY EARTH 0 < DYE_ELV < 5 5 < DYE_ELV < 10 10 < DYE_ELV < 20 20 < DYE_ELV < 30
N-K line 2005-8-13 2005-9-4 2005-10-22 2005-11-28 2005-12-24 2006-2-6 Day Earth 0 < DYE_ELV < 5 5 < DYE_ELV < 10 10 < DYE_ELV < 15 15 < DYE_ELV < 20 20 < DYE_ELV < 25 From Anabuki et al.’s poster Atmospheric N-K line Map XIS1(BI) Color code is adjusted for each map
2005-8-13 2005-9-4 2005-10-22 2005-11-28 2005-12-24 2006-2-6 Day Earth 0 < DYE_ELV < 5 5 < DYE_ELV < 10 10 < DYE_ELV < 15 15 < DYE_ELV < 20 20 < DYE_ELV < 25 Atmospheric O-K line Map XIS1(BI)
E0102-72 SN1006_NE_BGD Mrk 3 A2811_offset NGC 4388 MBM12_off Cloud N-K line O-K line N-K line O-K line N-K line O-K line N-K line O-K line N-K line O-K line N-K line O-K line Day Earth Radial Profile(vignetting corrected,normalized by center region)
N-K line O-K line Center 6mm radius / Other area • Mean Free Path in C(2.2g/cc) • 0.182mm for N-K line • 0.375mm for O-K line • Spatial Difference in Carbon contamination thickness can be modeled with Atmospheric N-K, O-K data. • Thickness at the center is evaluated by E0102 and RXJ1856 obs. • Thickness (t,detx,dety) will be modeled/introduced in arfbuilder (or rmfbuilder).
N-K line O-K line Contamination Rate is Decreasing ? [Central 6mm radius count rate] / [Outer area count rate] c.r.(center) - c.r.(outer)=0.9x10⁻³mm/day c.r.(center)~ 2.5x10⁻³mm/day c.r.(outer)=1.6x10⁻³mm/day Time(sec)
PKS2155-304 NH(Gal)=1.65e20cm~-2 XIS1(BI) NH(Gal)*Pow NH(Gal)*N_C*Pow NH(Gal)*N_C*N_O*Pow XIS3(FI) NH(Gal)*Pow NH(Gal)*N_C*Pow NH(Gal)*N_C*N_O*Pow
N_C vs N_O Cf DEHP(C24H38O4) N_O/N_C=1/6=0.17
If we assume the contaminant is DEHP… XIS1 XIS3 Assuming DEHP NH(Gal)*DEHP*Pow NH(Gal)*DEHP*Pow XIS1 XIS3 Best fit C/O ratio NH(Gal)*N_C*N_O*Pow NH(Gal)*N_C*N_O*Pow The data may not reject the possibility of DEHP.
NO = 0 Aug 05 Nature of Contaminant:1E 0102-72.3 Dec 05,Jan 06,Feb 06 • BI residuals change with time • Aug 2005 • ~ no contamination • Dec 2005 and later • excess absorption in model below 0.5 keV • too much C, adding O improves residuals • formally: NO/Nc < 0.2 (90%) NC/NO= 6 Aug 05 Dec 05,Jan 06,Feb 06
Nature of Contaminant:RX J1856.5 gain fit BI • BI: -10 eV shiftNO /NC <0.10FI: -3.5 eV shiftNO /NC < 0.11 FI 90% limit
Summary • QE degradation in Suzaku XIS has been studied. • Absorber (Contaminat) thickness: XIS0<XIS1<XIS2<XIS3 • C-absorber thickness: Rim ~ 1/2 of the Center • Contamination Rate was almost constant, but there is a hint that the rate is decreasing recently. • Carbon is dominant in Cotaminant . There is a small contribution of O; N_O/N_C <0.13, which is smaller than DEHP value of 0.17, but we need to consider systematic error of response models before concluding the contaminant is pure DEHP or not. • RXJ1856 observation in this March will help it • Modeling the QE degradation is in progress with E0102 data and atmospheric N-K line data. Promising at least for BI-CCD (XIS1) so far. However, low energy band will be unavailable if the QE degradation continues.