Download
1 / 26
260 likes | 285 Views
Orbital Calibration of Suzaku XIS. K. Hayashida, K. Torii, N. Anabuki, S. Katsuda, N. Tawa, T. Miyauchi, M. Nagai, K. Hasuike, M. Uchino,M. Namiki, H. Tsunemi (Osaka Univ.),

E N D
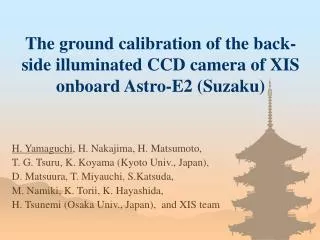
Orbital Calibration of Suzaku XIS K. Hayashida, K. Torii, N. Anabuki, S. Katsuda, N. Tawa, T. Miyauchi, M. Nagai, K. Hasuike, M. Uchino,M. Namiki, H. Tsunemi (Osaka Univ.), H. Matsumoto, T. G. Tsuru, H. Nakajima, H. Yamaguchi, Y. Hyodo, H. Uchiyama, M. Ozawa, K. Koyama (Kyoto Univ.), T. Dotani, M. Ozaki, H. Murakami, H. Katayama (JAXA), S. Kitamoto, D. Takei (Rikkyo Univ.), A. Bamba, J. Hiraga (RIKEN), S. Maeno, K. Mori (Miyazaki Univ), Y. Ishisaki (TMU), T. Kohmura (Kohgakuinn Univ.), E. Miller, B. LaMarr, S. E. Kissel, M. W. Bautz (MIT), and the Suzaku Team
Analysis of XIS data: Overview • Various corrections and default data selection were already applied to make those cleaned event lists at JAXA/GSFC. • Light curves, Spectra, Images are created with XSELECT (or its equivalents). • Further screening may be needed to avoid atmospheric N-K, O-K lines, or other background events (SWCE). • Response files (rmf and arf) are created with Suzaku FTOOLS, xisrmfgen & xissimarfgen. • Secular change in the detector response (OBF contamination, degradation in the energy resolution, etc.) are taken into account. • Background Database (Night Earth Data) is prepared and accessible via web. Standard XIS analysis is easy, if you start with cleaned event lists.
MIT-LL CCID41 CCD with Charge Injection AluminaSubstrate Flexprint Torlon Standoffs Au coated Cu Heatsink X-ray Imaging Spectrometer (XIS) • X-ray CCD Cameras onboard Suzaku • 3 FI-CCD (XIS0,XIS2,XIS3) • 1 BI-CCD (XIS1) • 1024x1024pixels(IA+FS) • FOV18’x18’ • CCD Temp = -90℃ • Low noise <3e- • Energy Range 0.2-12keV • AE/TCE + DE On November 9, about 2/3 of imaging area of XIS2, one of the X-ray CCD cameras, became suddenly unusable. All other sensors, XIS0, 1, 3, are fine. Currently the sensor XIS2 is not used for observations. In order to identify the cause and hopefully to recover, we are continuing diagnostic operation.
XIS Data Reduction XIS Response depends on the reduction procedure • Frame Data /8sec • Dark-level Subtraction • Event Pickup (PHAS(0)>Event Threshold) • 5x5 mode, 3x3 mode or 2x2 mode • Event data • AE-temp dependent Gain Correction • Charge Trail Correction • CTI correction • Grading / PHA-reproduction for PHAS(i)>Split Threshold • PHA-dependent Split Threshold for BI • EHK screening • Bad Columns Filter • xisclean • XIS cleaned event list Onboard DE PI values are determined in this procedure On the ground
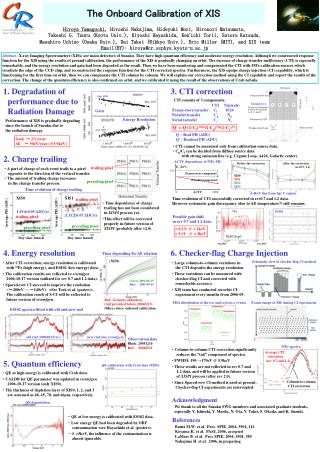
Mn-Ka 5.9keV Mn-Kb 6.5keV 55Fe Cal-Source→Gain monitor counts • Gain Decrease ~2%/year • Energy Resolution 140eV ->170~180eV @2006Apr CTI increase induced by orbital radiation damage of the CCD PH [ch] Peak PHA ch of Mn-Ka (Normalized to the ch at 1st ligt) Energy Resolution FWHM@5.9keV
Time depending Ex-ΔE relation (XIS0) Green: 2005-08-15 Blue: 2005-09-15 … every one month (Modeled) Energy Resolution used in xisrmfgen • Degradation of the energy resolution is taken into account in “xisrmfgen”
Spaced-row Charge Injection Injected charge: sacrificial event Injected charges Trap X-ray event Frame image of the XIS doing the SCI Transfer direction
SCI Results & Status Perseus cluster He-like Fe Ka • From 2006 Oct, users can chose an option to use SCI. (not for all modes) • Calibration for the SCI data would be different from those for the non-SCI data. • Additional dead area of 5%-7% is inevitable. Energy Resolution (FWHM) 205+/-6eV without the SCI 157+/-4 eV with the SCI
Mn Ka PHA peak & FWHM • For (“Non-SCI”) data, energy scale error is about 0.5% (>1keV) or 5eV(<1keV). MIT XIS team
Ex-PHA relation (Calibration on ground) Current Problem around Si-K edge is PHA ->PI relation contains “gap” in it to get a strict proportionality between PI and Ex. Near future, we will adopt a smooth PHA<->PI relation, instead the gap in Ex-PHA relation around the Si-K edge will be implemented into in the response matrices. Residual to straight line fit Residual to broken line fit +10eV -10eV Si K edge (E=1839 eV)
Quantum Efficiency • High energy part … Depletion depth in Si • Mostly studied by the XRT team (->Maeda-san’s talk) • Crab and other hard sources • Low energy part … Surface dead layer, OBF transmission, Contamination on it • E0102, RXJ1856, Cyg Loop and other stable soft sources • PKS2155 smooth continuum
C-K edge ~0.3keV a: Based Cal on the Ground b: a x excess0.15mmC c: Dead Layer =Design Value d: c x excess0.15mmC RXJ1856.5-3754 on 2005Oct
Thickness of Cotaminant on the XIS OBF (from repeated obs of E0102) Gradually Saturating by Eric Miller
Atmospheric Fluorescence Line • When the telescope is looking at the shining Earth or its atmosphere, fluorescence lines of the Earth atmosphere (N-K, O-K) by Solar X-rays are contaminated in the observed spectra. • Intensity and line ratio depends on the elevation angle from the Earth rim and the Solar activity. N-K (0.39keV) O-K (0.52keV) DAY EARTH 0 < DYE_ELV < 5 5 < DYE_ELV < 10 10 < DYE_ELV < 20 20 < DYE_ELV < 30
N-K line 2005-8-13 2005-9-4 2005-10-22 2005-11-28 2005-12-24 2006-2-6 Day Earth 0 < DYE_ELV < 5 5 < DYE_ELV < 10 10 < DYE_ELV < 15 15 < DYE_ELV < 20 20 < DYE_ELV < 25 Detected Intensity of N-K linecan be used to measure the contamination thickness
Contamination thickness distributionfor XIS1(BI) *) Estimations from N-K and that from O-K agree well. Thickness Distance from the FOV center
Composition(C,O) from PKS2155*) O/C=1/6 is currently used. O/C=1/6; offset_N_C=1.27 XIS3(2006) XIS3(2005) XIS2(2006) O/C=1/10; offset_N_C=0 XIS1(2005) XIS1(2006) XIS0(2005) XIS2(2005) XIS0(2006) *)Error bars are 90% error for 2parameters confidence,i.e., delta c2=4.61
How to treat Contamination in the Data analysis • HEASAC FTOOLS 6.1.1 contains “xissimarfgen”. It is used to “arf” in which QE degradation owing to contamination is taken into account. We recommend this “xissimarfgen”. • See web page or Ishisaki et al., 2006 (PASJ) • Alternative way is using absorption models of xspec, but with “arf” in which contamination is NOT taken into account.
Low background level is confirmed →Efficient for low surface brightness
Night Earth BGD Spectra 2 4 6 8 10 Ex (keV)
The NXB level is higher at larger ACTY, for which time spent on the frame store region is longer. The scattered component of Mn K from calibration sources is not negligible in XIS0. NXB Non-uniformity 7.2-7.8keV (Ni-Ka)3.0-7.0keV (Continuum) XIS0 XIS2 DETY DETY DETX DETX Mn-Ka band(5.7-6.0keV) image
Cut-off Rigidity dependent BGD Light Curve XIS1 NEP blank sky (2005/9/2) 5-10keV count rate vs COR XIS0XIS1XIS2XIS3 0.1-5.0keV Count rate 5.0-14.9keV COR Time (s)
Latitude. ≤ -23 (deg) & Altitude. ≥ 576.5 (km) and Latitude. ≥ 29 (deg) & Altitude. ≥ 577.5 (km) Background is basically correlated with COR;Search for the Deviation • Example1) High NXB level was observed (not necessarily always) in the following region. Altitude(km) Latitude(deg) Latitude(deg) Longitude(deg) Tawa et al. Poster
NXB database and reproducibility • 800ks NXB database (event-lists) is accessible from Suzaku page. • Associated tools to sort and to make COR weighted NXB spectra is available. • For 50ks of NXB data, 5-12keV statistical error is about 6% (FI), 3%(BI), while reproducibility is 7.0%, 6.8%, 11.6%, 7.6% (XIS0,1,2,3). • Further study is needed to improve the reproducibility, but the problem is in the low NXB (~0.05c/s/FI in 5-12keV) level. • COR database might be needed to update, too.
Not Yet • Updating CTI, Trail, Contamination database. • Various Softwares (Exposure maps,…) • Calibration of non-standard modes data • Calibration of SCI data • Continuous update of the database • etc,etc….
Summary • XIS calibration in orbit has been progressed. • Energy Scale, Energy Resolution • Degradation & SCI • QE, (Contamination) • BGD Thank you for your presentation on the Suzaku & XIS results in this conference. Feedback, please.