Download
1 / 1
10 likes | 100 Views
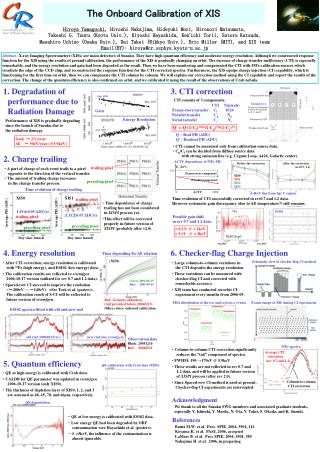
X-ray Imaging Spectrometers (XISs) on Suzaku face performance degradation in orbit due to radiation damage. This study presents a method using 55Fe calibration sources to monitor and compensate for Charge Transfer Inefficiency (CTI), which affects energy resolution and gain. It highlights the Correction Index (CI) capability for CTI compensation and discusses the impact of CTI on the performance of XISs. The text describes the CTI components, charge trailing effects, and the monthly Checker-flag Charge Injection (CI) experiments conducted to improve energy resolution. The results reflect the need for CTI corrections and quantum efficiency calibration using Crab data. The study suggests future versions of XISPI for proper correction of charge trailing effects and energy resolution variations.

E N D
Imaging Area Frame-store Area Hiroya Yamaguchi, Hiroshi Nakajima, Hideyuki Mori, Hironori Matsumoto, Takeshi G. Tsuru (Kyoto Univ.), Kiyoshi Hayashida, Ken’ichi Torii, Satoru Katsuda, Masahiro Uchino (Osaka Univ.), Dai Takei (Rikkyo Univ.), Eric Miller (MIT), and XIS team Email(HY): hiroya@cr.scphys.kyoto-u.ac.jp The Onboard Calibration of XIS Abstract: X-ray Imaging Spectrometers (XISs) are main detectors of Suzaku. They have high quantum efficiency and moderate energy resolution. Although we constructed response function for the XIS using the results of ground calibration, the performance of the XIS is gradually changing on orbit. The increase of charge transfer inefficiency (CTI) is especially remarkable, and the energy resolution and gain had been degraded as the result. Then we have been monitoring and compensated the CTI with 55Fe calibration sources which irradiate the edge of the CCD chip, and reconstructed the response function for the CTI corrected spectra. Furthermore, the XIS equips charge injection (CI) capability, which is functioning for the first time on orbit, then we can compensate the CTI column by column. We will explain our correction method using the CI capability and report the results of the correction. The change of the quantum efficiency is also confirmed on orbit, and we calibrated it using the result of the observations of Crab nebula. 3. CTI correction • Degradation of performance due to Radiation Damage CTI consists of 3 components. CTI N(pixels) Frame-store tarnsfer Cf 1024 Parallel transfer Cp Np Serial tarnsfer Cs Ns Gain Energy Resolution Performance of XIS is gradually degrading since the launch of Suzaku due to the radiation damage. Q’ = Q (1-Cf)1024(1-Cp)Np(1-Cs)Ns Q : Real PH (ADU) Q’ : Readout PH (ADU) Gain ~ 2%/year ΔE ~ 50eV/year (@5.9keV) ・ CTI cannot be measured only from calibration source data. ・ Cp/Cf can be decided from diffuse source data with strong emission line (e.g. Cygnus Loop, A426, Galactic center). 2. Charge trailing ACTY dependence of 55Fe PH. Before the correction. After the correction. (rev0.7, 1.2) Ex (keV) trailing pixel ・ A part of charge of each event trails to a pixel opposite to the direction of the vertical transfer. ・ The amount of trailing charge increases in the charge transfer process. 5.9 Frame-store component XIS0 XIS1 XIS2 XIS3 Parallel component preceding pixel Time evolution of charge trailing 0 ACTY 1000 6.4keV line from Sgr C region. XIS0 XIS1 Time evolution of CTI successfully corrected in rev0.7 and 1.2 data. However systematic gain discrepancy (due to AE temperature?) still remains. trailing pixel ・ Time dependence of charge trailing has not been considered in XISPI process yet. ・This effect will be corrected properly in future version of XISPI (probably after v2.0). 1.19±0.05 ADU/yr 55Fe E0102 Average PH (ADU) Average PH (ADU) 1.11±0.07 ADU/yr Possible gain shift in rev 0.7 and 1.2 data. trailing pixel 〜±0.2 % preceding pixel preceding pixel < 0.2% @ > 1keV < 5 eV @ < 1keV XIS0 Seg0 Day since launch Day since launch Aug.2005 Jun.2006 4. Energy resolution 6. Checker-flag Charge Injection Time depending Ex-ΔE relation (XIS0) Schematic view of checker-flag CI method. ・ Large column-to-column variations in the CTI degrades the energy resolution. ・ These variations can be measured with checker-flag CI and corrected with remarkable accuracy. ・ XIS team has conducted on-orbit CI experiment every months from 2006-05. ・ After CTI correction, energy resolution is calibrated with 55Fe (high energy), and E0102 (low energy) data. ・ The calibration results are reflected to xisrmfgen 2006-10-17 version (utilized for rev 0.7 and 1.2 data). ・ Spaced-raw CI succeed to improve the resolution (~200eV → ~140eV). <See Torii et al. (poster)>. The calibration result of S-CI will be reflected to future version of xisrmfgen. Green: 2005-08-15 Blue: 2005-09-15 … Red: Ground calibration (rmf provided before 20060213). Other colors: onboard calibration. PHA distribution of the test and reference events. Frame image of XIS during CI experiment. E0102 spectra fitted with old and new rmf old rmf (20060213ver.) new rmf (use xisrmfgen) Observation date Black: 20051216 Red: 20060521 55Fe spectra ・ Column-to-column CTI correction significantly reduces the “tail” component of spectra. ・ FWHM: 190 →170eV @ 5.9keV ・ These results are not reflected in rev 0.7 and 1.2 data, and will be applied in future version of XISPI process (after rev 2.0). ・ Since Spaced-row CI method is used at present, Checker-flag CI experiments are interrupted. Average CTI correction (rev 0.7 and 1.2) 5. Quantum efficiency QE calibration with Crab data (XIS0). ・ QE at high energy is calibrated with Crab data. ・ CALDB for QE parameter was updated in xisrmfgen 2006-10-17 version (only XIS0). ・ The thickness of depletion layer of XIS0, 1, 2, and 3 are assumed as 68, 45, 70, and 66μm, respectively. Column-to-column CTI correction Acknowledgment QE degradation We thank to all the Suzaku SWG members and associated graduate students, especially Y. Ishisaki, Y. Maeda, N. Ota, Y. Takei, S. Okada, and K. Suzuki. ・ QE at low energy is calibrated with E0102 data. ・ Low energy QE had been degraded by OBF contamination <see Hayashida et al. (poster)>. ・ @ >5keV, the influence of the contamination is almost ignorable. References Bautz M.W. et al. Proc. SPIE, 2004, 5501, 111 Koyama K. et al. PASJ, 2006, accepted LaMarr B. et al. Proc SPIE, 2004, 5501, 385 Nakajima H. et al. 2006, in preparing