Download
1 / 41
410 likes | 564 Views
XIS Calibration on the Ground Status Report. K. Hayashida (Osaka University) and the XIS-team. XIS Components. XIS-Sensors CCID41-FI CCD EU (Engineering Unit) FM FI0 , FI1 , FI2,FI3 CCID41-BI CCD FM BI0 , BI1 AE/TCE FM AE/TCE01,23 EM AE/TCE DE FM 4PPU+MPU. FM Spare before Launch.

E N D
XIS Calibration on the GroundStatus Report K. Hayashida (Osaka University) and the XIS-team
XIS Components • XIS-Sensors • CCID41-FI CCD • EU (Engineering Unit) • FM FI0,FI1,FI2,FI3 • CCID41-BI CCD • FM BI0,BI1 • AE/TCE • FM AE/TCE01,23 • EM AE/TCE • DE • FM 4PPU+MPU FM Spare before Launch
XIS Data Reduction XIS Response depends on the reduction procedure • Frame Data /8sec • Dark-level Subtraction • Event Pickup (PH(E)>Event Threshold) • 5x5 mode, 3x3 mode or 2x2 mode • Event data • Charge Trail Correction • Grading / PHA-reproduction for PH(i)>Split Threshold • PHA-dependent Split Threshold for BI • Bad Columns Filter • Spectrum / Image / Light Curve Onboard DE * :Newly introduced On the ground
grade0 grade4 grade1 grade5 grade2 grade6 grade3 grade7 Pixel level is maximum among 3x3 area and larger than Event threshold Event Grades Pixel level is larger than Split threshold and added to the PHA • Grades 02346 are used as X-ray events. Pixel level is larger than Split threshold but NOT added to the PHA
PH [ADU] PH [ADU] PH [ADU] PH [ADU] PH(2),PH(7) distributionPH(2)= preceding pixel ,PH(7)=trailing pixel BI1 5.9keV X-ray incidence RAWY a b Near readout node d c b Far from readout node a c d
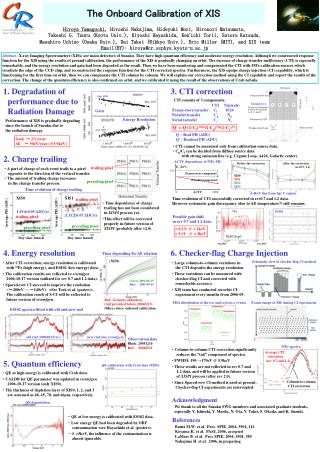
-6 CTI = (4.5±0.3)×10 [ /Transfer ] Amount of Charge in the Trail Mn K BI1 Slope ↓ CTI estimated from this trailing charge PH(7)Center [ADU] *) temperature dependence was observed Number of V-Transfer in the Imaging Area
-4 -4 -0.5 -0.5 VCTI= (1.72・10 )×E HCTI= (6.06・10 )×E Incident X-ray Energy Dependence H-transfer V-transfer We can tell the amount of charge deposited in PH(7) and PH(5) => Charge Trail Correction
PH [ADU] PH [ADU] PH [ADU] PH [ADU] PH [ADU] PH [ADU] PH [ADU] PH [ADU] PH(2),PH(7) Distribution before/after Charge Trail Correction
Effects of Charge Trail Correction • Correct Grade Branching Ratio and PH() • Reduce Grade7 events due to Charge Trail. 10%-20% increase in Grade02346 ratio at high energies. • Restore Non-uniformity in effective QE. • (Partial) Restoration in the Energy Scale. • Traps with Other time scales are not negligible.
G02346 event number FWHM (eV) Optimization of Split Threshold for BI1 Spth (ADU)
PHA-dependent SpTh PHA-dependent Split Threshold for BI
X-ray image (number of events /pixel) Bad (CTE) Columns • Bad CTE • Typically long trail in each event. • Sometimes flickering pixel is observed. • Rows near the readout node can be used. • Identification logic without accumulating 10^7events was developed. • EU= 21 bad columns/chip • FI0=14, FI1=12, FI2=17,FI3=24 • BI0=23, BI1=50 • How should we do for adjacent columns ?
Kyoto Cal System • Fluorescent X-rays (Al,Cl,Ti,Mn,Fe,Zn,Se) • Windowless Si-SSD is used as the reference counter, assuming 100% efficiency >1.5keV • XIS FI-CCD QE=96%@4.5keV is assumed
Calibration Facility in the Osaka Clean Room Detector Chamber Manson Soft X-ray Generator Hetrick Spectrometer
Dispersion (Grating) Spectrum projection • X-ray image X-ray energy FWHM~5eV O-Kα(0.53keV) C-Kα(0.28keV) Dispersion direction Number of events/columns
Astro-E1 (FI) XIS Astro-E2 (FI) XIS Line profile against O-K line incidence 5 kV FI2 PHA(ADU) XIS1 (H.Katayama master thesis)
Line Profile model (1) Main Peak:Absorption in Depletion Layer (2)Sub Peak:Lost charge below Split-threshold (3) Triangle Comp.:Channel Stop origin (4) Constant Comp.:Partial absorption in SiO2 F3 parameters: T1 (normalization),C1(center), S1(sigma) T2 (relative to T1),C2(spth/2, fixed), S2 (1.78×S1, fixed) T3 (relative to T1), F3(三角形の幅, 0.5×C1) T4 (T1で規格化した面積) → フリーパラメタ 6個 でフィット BI structure
Line profile for FI1 sensor Se-L line E=1.379keV O-K line E=0.525keV T2=0.033, T4=0.0052 T2=0.020, T4=0.0045 (Seg.B)
Line profile for BI1 sensor C-K line E=0.277keV Al-K line E=1.487keV O-K line E=0.525keV T2=0.19, T4=0.015 T2=0.071, T4=0.011 T2=0.078, T4=0.016
BI1 g02346 スペクトルの比較
Energy and Pulse-height Linearity BI1, Seg.C FI1, Seg.C
Energy Resolution (FWHM) FI-1, Seg.C BI-1, Seg.C
Quantumn Efficiency Measurement at Osaka • Relative Efficiencies of FM-FI0,FI1,FI2,FI3,BI0,BI1 and XIS-EU are measured by irradiating X-rays from the spectrometer to whole the CCD area. • Generator beam current is always monitored and stabilized <1%. • XIS-EU was cross-calibrated to a Gas PC on 2003Dec & 2004Jul. XIS-FM are not installed in the chamber with the Gas PC simultaneously. • The gas PC was calibrated through the slant incident method in 2004 January.
X-rays X-rays Slant Incident Method: Application to Gas PC We determined to use the Gas PC as the reference counter
Gas PC Spectra for Different Incident Angle Counts PH (ch) 45° 30° 0°
Ratio of Counting rate of Gas PC 30°/0° 45°/0°
X-rays through Slit ( ~1mm) Dispersion Direction
PC Spectra and CCD Spectra PC (0.525keV) XIS-EU (0.525keV)
Relative QE of FMFI / XIS-EU Red=determined from the line components Long term variability is too high to be precisely corrected FI0 FI1 FI2 FI3
Relative QE of BI0,BI1 to XIS-EU BI1 BI0 ~80@0.28 keV~10@0.6 keV
XAFS near the O-Kedge FI-2 Eedge = 0.532 ±0.001 keV red. c2 = 1.3178 (d.o.f. = 418)
Upper limit of Surface dead layer in BI-CCD Dispersion Spectrum with BI 0.45 0.5 0.55 0.6 keV μm (H2O) H2O on BI1 <0.11 μm
Absolute QE issues • Reconsider the assumptions • 96% at 4.5keV for XIS-FI • Check grade7 events ? • Gas PC window model • Mesh measurement ? • ACIS BESSY calibration • How was the effective area or normalization calibrated ? • How about Channel Stop events ? Hidden dead space in FI ? • Adopt the BI1 QE as a reference • BI QE should not be 1 (at least a few % grade 7 events) • How do we model F_data-reduction ? • Application of the Slant Incidence method to BI0 after the Astro-E2 launch. Any other good way for the absolute QE cal ? • Energy independent factor of 10% is not a problem. Edge structure of 10% might be a problem.
Summary • We have completed the calibration experiments on the ground for XIS flight models. • Data reduction procedures were updated for Astro-E2 XIS. • Conversion to FTOOLS will be required. • Profile has less tail component than Astro-E1 XIS. • Relative QE between the XIS sensors were accurately measured <5%?. • We need further work on absolute QE.