Download
1 / 16
170 likes | 296 Views
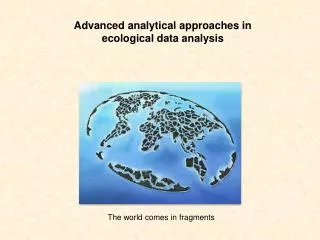
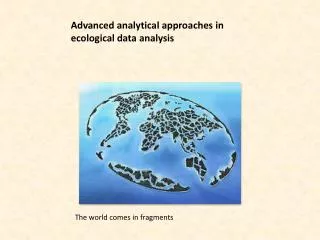
Advanced analytical approaches in ecological data analysis. The world comes in fragments. Multivariate approaches to biodiversity. Sites. Environmental variable matrix V. Spatial regression Co-occurrence mapping Regression tree Impact analysis. Variables. Sites.

E N D
Advanced analytical approaches in ecological data analysis The world comes in fragments
Multivariate approaches to biodiversity Sites Environmental variable matrix V Spatial regression Co-occurrence mapping Regression tree Impact analysis Variables Sites Site GPS location matrix D L Sites Species abundance matrix M Species
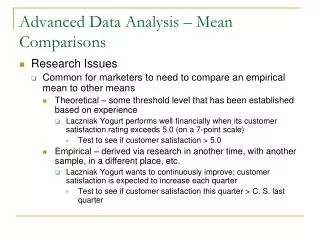
The raw data • Basic questions: • Do soil characteristics influence species abundances and diversity? • How do these relationships change in time? • Starting hypotheses: • Neighboured plots are similar in species composition. • CaCO3 is of major importance for plant diversity. • Species occurrences is not random with respect to soil characteristics
Neighboured plots are similar in species composition Mantel test We calculate the Soerensen (Dice) index of species similarity and transform to a distance matrix (D = 1 – S) We calculate the distance matrix of GPS data
CaCO3 is of major importance for plant diversity The SAM input file Speciesrichness CaCO3
General linearmodels in the face of spatialautocorrelation Species richness at sites of different area We did not include the spatial distance into the regression 35 5 7 5 17 41 1 Spatial autocorrelation is inevitable in ecology
Collinearity 35 5 7 5 17 41 Spatial autocorrelation 1 Autocorrelation Spatial autocorrelation is inevitable. All ecological field data sets have a spatial structure.
Bivariate case Statistical significanceat the 1% error level F increases proportionally to the degrees of freedom n, that is to the number of data points. P decreases with increasing number of data points (sample size). Any statistical test will eventually become significant if you only increase the sample size.
41 7 1 7 17 35 5 7 7 5 Spatial autocorrelation 7 Spatial autocorrelation reduces the effective degrees of freedom. 17 35 Using spatially autocorrelated data we artificially increase the degrees of freedom and the F-score. We get too often statistically significant results. 7 7 17 35 First, test for spatial autocorrelation: Moran’s I 7 What to do???
What to do??? Reduce the degrees of freedom N = 15 Neff = 4 Neighbor joining cluster analysis UPGMA clusteranalysis
What to do??? Correct for the effects of spatial autocorrelation
What to do??? Correct for the effects of spatial autocorrelation Trend surface analysis is able to capture broad scale trends S Eigenvector regression or eigenvector mapping
Autocorrelation models Multiply Yand Xby a spatial corrective Often all the wholevariance goes into the spatial component leaving no room for the predictors. Spatial weights of C The larger a the more variance goes into space. a = means no spatial effect (OLS). r is an additional weight factor (r < 1). r = 0 means no spatial effect (OLS). r = 1 means all variance goes into space.
The inputtabdelimitedtext file for SAM No clearspatial trend in speciesrichness
Do soil properties influence species richness? The Hühnerwasser catchment is divided into a western and an eastern part with different sand soil content and pH. Trend surface analysis captures this gradient. The dependence of richness on pH vanishes after accounting for spatial structure.