Download

1 / 15
150 likes | 291 Views
This work delves into advanced analytical techniques for ecological data analysis, focusing on multivariate methods to understand biodiversity. Key matrices, including species trait, phylogenetic distance, and environmental variables, are utilized to explore interdependencies in ecological communities. The study highlights Pearson coefficients and fourth-corner statistics for trait-environment correlations, while emphasizing the significance of species co-occurrences and succession patterns. Results indicate critical relationships among traits, phylogenetic distances, and soil characteristics, shedding light on community structuring processes.

E N D
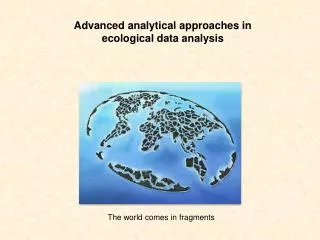
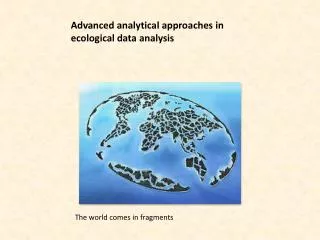
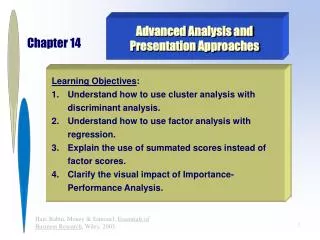
Advanced analytical approaches in ecological data analysis The world comes in fragments
Multivariate approaches to biodiversity Traits Sites Interdepen-dence matrix X Environmental variable matrix V Variables Variables Traits Species Sites Species trait matrix T Phylogenetic distance matrix P Species abundance matrix M Species Species Species
Fourth corner statistics k n Species trait matrix T Species abundance matrix M n Environmental variable matrix V l m m m species, n sites, k traits, l environmental variables The matrix X is a kl matrix that contains information on the relationhips between traits and environmental variables mediated by species abundances or occurrences .
The Pearson coefficient of correlation Using Z-scores in fourth corner analysis leads to correlations between traits (phylogeny) and environmental (geographical) variables.
The SES scores for traits of the proportional – proportional null model We detect three significances. Three significancesis exactly the random expectation a the 5% error level. None of the relationships is really significant. Use Bonferroni corrected significance levels!
Correlation coefficients and a neutral null model (AA) Clumped species co-occurrences
The SES scores for phylogeny of the proportional – proportional null model • Phylogenetic distance was negatively related to soil carbon content andsand. • Phylogenetic distance was positively related to soil pH. • Phylogenetic distance was positively related to soil species richness and abundance.
Phylogenetic species co-occurrences Count for all checkerboard, clumped and togethernerss pairs the average phylogenetic and variable distances. Compare these average with the random distribution after randomisation of the species occurrence matrix.
Each effect is linked to an ecological pattern that can be related to an ecological process.
Phylogenetic relatedness during succession : Clumping : Togetherness : Checkerboard • Phylogenetic distances of co-occurring species increased during early succession. • Phylogenetic distances of segregated species decreased. • At the onset of succession phylogenetic community structure was random. • 2008 marks a tipping point from a random to a structured pattern.
CaCO3 Sand : Clumping : Togetherness : Checkerboard pH Co-occurrences in dependence on soil variables • At the beginning of succession SES score were negative. Species co-occurred on similar soils (habitat filtering). • At the end of the succession species co-occurred on different soils and co-occurred less often on soils osf similar structure. This points to competitive effects.
PCA, PCoAmultiplots ChickenCreek 2011 data Eigenvector multiplots serve as a graphical representation of species associations with trait or soil variables.
Principal coordinates analysis (Bray Curtis metric of distance) links the eigenvectors of species, trait, and environmental variable eigenvectors • Leaf features are linked to the pH gradient. • Seed weight is connected to the sand gradient