Advanced analytical approaches in ecological data analysis
280 likes | 444 Views
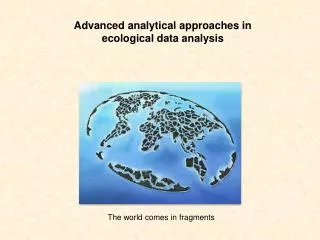
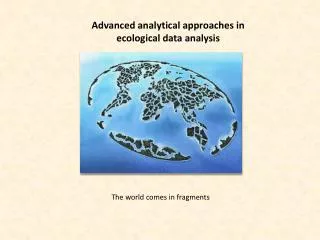
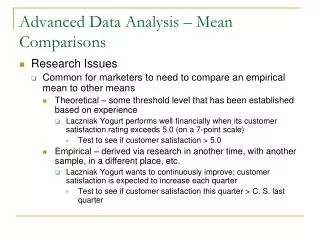
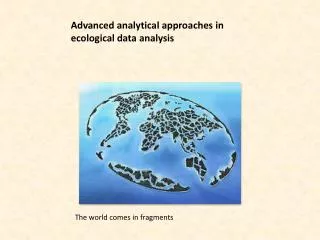
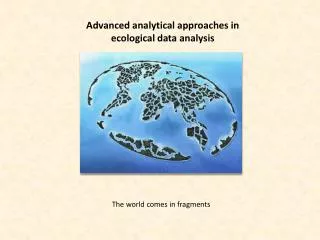
Advanced analytical approaches in ecological data analysis. The world comes in fragments. Early plant succession in the post brown cole mining area Chicken Creak. 2005. 2010.

Advanced analytical approaches in ecological data analysis
E N D
Presentation Transcript
Advanced analyticalapproaches in ecological data analysis Theworldcomesinfragments
Early plant succession in the post brown cole miningareaChickenCreak 2005 2010 Successionstarts with colonisingspecies from a regionalspeciespooland from the initialseed bank
Multivariate approaches to biodiversity Traits Sites Interdepen-dence matrix X Environmental variable matrix V Variables Variables Why are species abundant or rare? What determines community composition? How does a community function in space and time? Sites Site GPS location matrix D L Traits Species Sites Species trait matrix T Phylogenetic distance matrix P Species abundance matrix M Species Species Species
The interplay between traits, phylogeny, and species occurrences Traits Species Sites Species trait matrix T Phylogenetic distance matrix P Species abundance matrix M Species Species Species Competition: niche conservatism causes phylogenetically close species to co-occur less common. Habitat filtering causes species with similar traits (close in phylogeny) to co-occur more frequent. Traits and phylogeny are closely related. Trait distance correlates positively with phylogenetic distance Niche conservatism As species of the same genus have usually, though by no means invariably, some similarity in habits and constitution, and always in structure, the struggle will generally be more severe between species of the same genus, when they come into competition with each other, than between species of distinct genera. (Darwin 1859)
Early succession Regional pool of species Regional pool of species Facilitation Regional pool of potential colonizers Environmental filters Random colonization Phylogenetic segregation Phylogenetic clumping No phylogenetic structure No phylogenetic structure Local colonizers Later succession Competition Positive interactions Neutral interactions Phylogenetic segregation No phylogenetic signal Phylogenetic clumping Local community structure
Traits Species Species trait matrix T Phylogenetic distance matrix P Species Species Mantel test A Mantel test is a correlation between two distance matrices. We have to transform the trait matrix into a distance matrix and correlate with the phylogeny matrix.
Mantel test R = -0.04; P(r=0) = 0.37 Plant traits and phylogeny in the year 2011 arenot correlated. Why?? We averagedoveralltraits
Trait Trait 10 10 Blue eyes Blue eyes 5 5 10 10 10 10 Blue eyes Brown eyes 15 15 Blue eyes Blue eyes Brown eyes Brown eyes 12 12 8 8 12 12 Brown eyes Blue eyes Eye colour is phylogenetically not conserved. The trait ‚brown eyed’ is phylogenetically conserved. Closely related species have the same eye colour Blue eyes: (10+5+10+15)/3=10 Blue eyes: (10+5+15++10+ 8+12)/3=20 Compare these phylogenetic distances per trait with those expected from a random (Brownian motion ) phylogeny.
Brownian motion Brownian motion is the standard method to generate random phylogenetic trees Start with a pixel Take a second pixel and move at random until it sticks to the first Repeat two until the desired number of end-tips is reached. Brownian motion generates random trees and can simulate the evolution of traits along this trees.
Brownian motion(random walk) along a phylogeny Blue eyes Blue eyes Blue eyes Blue eyes Blue – brown boundary Brown eyes Compare the observed pattern of blue and brown with those generated by many Brownian motion trees.
Moran’s I as a test of phylogenetic signal w defines the strength of distance effects. where n is the number of data points. I is similar to a weighed coefficient of correlation.
Morphological and genetic plant traits are phylogenetically more conserved than life history, reproductive, and ecological traits.
Body size Species daily home range Ungulates 10 Large size Small home range 5 10 10 Without phylogenetic knowledge we would link body size to home range in a functional manner. Large size Small home range 15 Small home range Large size Small size Large home range 12 8 12 Phylogenetic pseudoreplication Large home range Small size Mammal predators Home range and body size are linked by common phylogeny. They are phylogenetically preserved. Phylogenetic regression accounts for the phylogenetic non-independence of variables
Traits Species Species trait matrix T Phylogenetic distance matrix P Species Species Eigenvector methods Every square matrix M has a vector U so that Because both sides of the equation are equal the right side contains the same information as the left side. The eigenvector U contains the information in M in a condensed form. M U U = l x U: Eigenvector l: Eigenvalue I: Identity matrix
The Euclideandistancematrix The dominant eigenvector(DEV) contains 86% of variance in the distancematrix.
DEV contains information on the average distance of species in niche space None of the traits is correlated to phylogenetic distance.
Ecological niches Convex hulls, eigenvector ellipses, and functional attribute diversity
The area of the eigenvector ellipse is a measure of niche space EV2 EV1 l1 l1 Axes length are given by the respective eigenvalues The niche space spanned by light and soil fertility spans 3.47 units. The larger the niche space is the higher is the functional diversity of a community or a species. Eigenvectors are always orthogonal. Compare these value with those obtained from a null model
Convex hulls CH The area of a convex hull is a measure of total niche space. Two dimensional convex hulls are easy to calculate. -… High dimensional convex hull are difficult to obtain.
Functional attribute diversity FAD Raw FAD scores are meaningless. You have to compare these scores with an appropriate null model of species occurrences.
Total raw functional attribute diversity (grey bars) increased while the respective SES scores of FAD (red bars) and convex hulls (blue bars) decrease during succession when compared to a neutral null model . High plant cover decreased an species richness increases standardized effect sizes of FAD (neutral null model) in all study years. Soil characteristics did not significantly influence SES FAD (functional diversity). 2011 2006 Regression coefficients
The evolutionary dimension of species occurrences Eigenvector mapping, eigenvector regression, logistic eigenvector regressiuon Species EV1 EV2 Sites Species abundance matrix M Phylogenetic distance matrix P Species Species Significant eigenvectors The explained variance r2 of this regression is a measure of the influence of evolutionary history on species abundances.
Net relatedness index Abundance vector Phylogenetic distance matrix The raw net relatedness index is the phylogenetic distance of all species present at a focal site. Calculate the raw NRI from 1000 randomized abundance matrices NRI increases with increasing phylogenetic clustering Randomized bundance vector