Download
1 / 22
220 likes | 357 Views
This work explores sophisticated analytical methods to assess ecological data, focusing on species occurrences in fragmented habitats such as islands, lakes, and urban areas. It highlights the significance of presence-absence matrices and multivariate analyses in understanding species abundance, community composition, and ecological interactions over space and time. The study delves into frameworks for assessing colonization patterns, extinction processes, and species interactions, employing various software tools for robust ecological modeling and interpretation of biodiversity patterns.

E N D
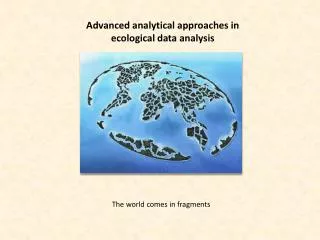
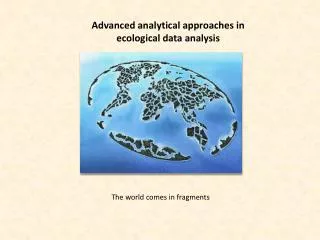
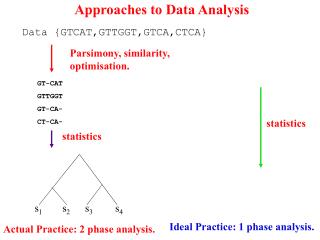
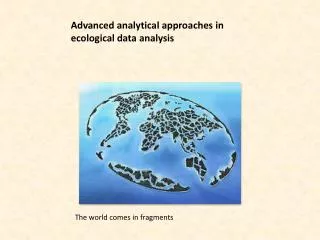
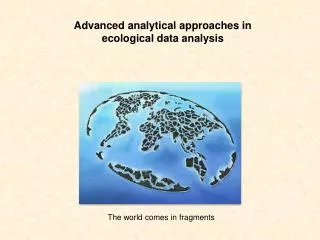
Advanced analytical approaches in ecological data analysis The world comes in fragments
Biogeography Species occurrences across a fragmented landscape Islands Lakes River bed and irrigation systems Mainlandscontinental distributionshabitat islandsmountain tops and valleysfragmented landscapesscattered distributed host plants Cities and anthropogenic habitats Routes of species invasion Experimental plots (natural, macro-, meso-cosm experiments)
Galapagos Islands The Darwin finches
The Darwin finches (Sanderson, Am. Scient. 2000) A presence – absence matrix reflects the distribution of species across sites
The distribution of ground beetles across Mazuran lake islands In presence – absence matrices zeros denote species absence, ones denote species presences. Absences might be caused either by real absences of species or by incomplete detection.
Multivariate approaches to biodiversity Traits Sites Interdepen-dence matrix X Environmental variable matrix V Variables Variables Why are species abundant or rare? What determines community composition? How does a community function in space and time? Sites Site GPS location matrix D L Traits Species Sites Species trait matrix T Phylogenetic distance matrix P Species abundance matrix M Species Species Species
Species and environmental data in primary plant succession Measured environmental data WordClim, BioClim Plant species trait data from Bioflor and Leda GPS longitude and latitude data Observed species abundances Phylogenetic data from Genbank or own sequencing
Biogeographic matrices are static descriptions of colonization patterns. Colonization and extinction are permanent processes. In reality presence – absence pattern change whole the time. It makes therefore a difference if we use temporal point data to construct our matrices or a time series. Time series data contain much more entries but might be ecologically unrealistic.
Time axis Time series matrices have too many entries and do not reflect real ecological patterns. They do not give information on real species interactions Dispersion Extinction For a proper assessment of ecological patterns we need point data. The comparison of point and time series matrices gives information about dispersion rates.
The distribution of ground beetles across Mazuran lake islands Abundance matrices contain additional information. Abundance matrices might be based on point or averaged time series data.
Mutual interaction matrices Food webs Host – parasite networks Plant – herbivore networks Pollination networks Predator – prey networks Competition networks Species impact networks Food web example Translation of a food web into a matrix. Ones denote direct links. Typical terrestrial food web Generalist predator Specialist predator
Interaction strength is expressed by probabilities or by frequencies of interaction A quantitative food web
Interaction matrices Pollination networks Plants From Ollerton et al. 2003 From Kratochwil et al. 2009 Bees
How to present a presence – absence matrix? Unsorted raw data Sorted according to marginal totals Sorted to maximize species turnover Correspondence analysis Reciprocal averaging (seriation)
Ecological gradients Spatial or ecological distance Sorting of matrix columns according to ecological gradients allows for an assessment of the importance of environmental variables.
Basic patterns Species turnover Species turnover or beta diversity is a special case of species segregation where there is an ordering change in species composition across the sites. Raw matrix Ordinated presence – absence matrix Spatial distance between species Ecological distance between sites Unexpected occurrences
Software • Niche – A Fortran program for meta-community analysis. • Turnover – A Fortran program for the analysis of species associations. • NODF – a Fortran program for nestedness analysis. • Past • Matrix Excel add in • Literature • Zaplata M. K., Winter S., Fischer A., Kollmann J., Ulrich W. 2013. Species-driven phases and increasing structure in early-successional plant communities. Am. Nat. 181: E17-E27. • Ulrich W., Gotelli N. J. 2013. Pattern Detection in Null Model Analysis. Oikos 122: 2-18. • Gotelli N. J., Ulrich W. 2012. Statistical challenges in null model analysis. Oikos 121: 171-180. • Ulrich W., Gotelli N. J. 2012. A null model algorithm for presence – absence matrices based on proportional resampling. Ecol. Modell. 244: 20-27. • Ulrich W., Piwczyński, M., Maestre F. T., Gotelli N. J. 2012. Null model tests for niche conservatism, phylogenetic assortment and habitat filtering. Meth. Ecol. Evol. 3: 930-939. • Ulrich W., Almeida-Neto M., Gotelli N. G. 2009. A consumer’s guide to nestedness analysis. Oikos 118: 3-17.