Download
1 / 28
480 likes | 1.58k Views
The Chi-Square Test for Association. Math 137 Fall‘13 L. Burger. -The Chi Square Test. A statistical method used to determine goodness of fit Goodness of fit refers to how close the observed data are to those predicted from a hypothesis Note:

E N D
The Chi-Square Test for Association Math 137 Fall‘13 L. Burger
-The Chi Square Test • A statistical method used to determine goodness of fit • Goodness of fit refers to how close the observed data are to those predicted from a hypothesis • Note: • The chi square test does not prove that a hypothesis is correct • It evaluates to what extent the data and the hypothesis have a good fit
-Determine The Hypothesis:Whether There is an Association or Not • Ho : The two variables are independent (not matching up well!) • Ha : The two variables are associated (variables matching good --- called a ‘good fit!’)
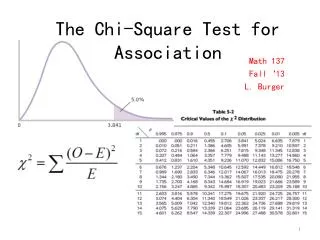
Understanding the Chi-Square Distribution • You see that there is a range here: if the results were perfect you get a chi-square value of 0 (because obs = exp). This rarely happens: most experiments give a small chi-square value (the hump in the graph). • Note that all the values are greater than 0: that's because we squared the (obs - exp) term: squaring always gives a non-negative number. • Sometimes you get really wild results, with obs very different from exp: the long tail on the graph. Really odd things occasionally do happen by chance alone (for instance, you might win the lottery).
Critical Chi-Square • Critical values for chi-square are found on tables, sorted by degrees of freedom and probability levels. Be sure to use p = 0.05. • If your calculated chi-square value is greater than the critical value from the table, you “reject the null hypothesis”. • If your chi-square value is less than the critical value, you “fail to reject” the null hypothesis (that is, you accept that your theory about the expected ratio is correct).
-Calculating Test Statistics • Contrasts observed frequencies in each cell of a contingency table with expected frequencies. • The expected frequencies represent the number of cases that would be found in each cell if the null hypothesis were true ( i.e. the nominal variables are unrelated). • Expected frequency of two unrelated events is product of the row and column frequency divided by number of cases. Fe= Fr Fc / N
4. Calculating Test Statistics Observed frequencies Expected frequency Expected frequency
-Determine Degrees of Freedom df = (R-1)(C-1) Number of levels in column variable Number of levels in row variable
-Compare computed test statistic against a tabled/critical value • The computed value of the Pearson chi- square statistic is compared with the critical value to determine if the computed value is improbable • The critical tabled values are based on sampling distributions of the Pearson chi-square statistic • If calculated 2 is greater than 2 table value, reject Ho
Example 1: One-dimensional • Suppose we want to know how people in a particular area will vote in general and go around asking them. • How will we go about seeing what’s really going on?
-Determine Hypotheses • Ho : There is no difference between what is observed and what is expected. • : There is an association between the observed and expected frequencies. • Solution: chi-square analysis to determine if our outcome is different from what would be expected if there was no preference
Reject H0 • The district will probably vote democratic, there is association between what is observed and what is expected. • However…
Conclusion of Example 1 • Note that all we really can conclude is that our data is different from the expected outcome given a situation • Although it would appear that the district will vote democratic, really we can only conclude they were not responding by chance • Regardless of the position of the frequencies we’d have come up with the same result • In other words, it is a non-directional test regardless of the prediction
Example 2-Two Dimensional • Suppose a researcher is interested in voting preferences on gun control issues. • A questionnaire was developed and sent to a random sample of 90 voters. • The researcher also collects information about the political party membership of the sample of 90 respondents.
Bivariate Frequency Table or Contingency Table Observed frequencies
Row frequency Bivariate Frequency Table or Contingency Table
Bivariate Frequency Table or Contingency Table Column frequency
-Determine The Hypothesis • Ho : There is no difference between D & R in their opinion on gun control issue. • Ha : There is an association between responses to the gun control survey and the party membership in the population.
-Calculating Test Statistics = 50*25/90
-Calculating Test Statistics = 40* 25/90
-Calculating Test Statistics = 11.03
-Determine Degrees of Freedom df = (R-1)(C-1) =(2-1)(3-1) = 2
-Compare computed test statistic against a tabled/critical value • α = 0.05 • df = 2 • Critical tabled value = 5.991 • Test statistic, 11.03, exceeds critical value • Null hypothesis is rejected
-Conclusion of Example 2 -Democrats & Republicans differ significantly in their opinions on gun control issues • Ho : There is no difference between D & R in their opinion on gun control issue. • Ha : There is an association between responses to the gun control survey and the party membership in the population.