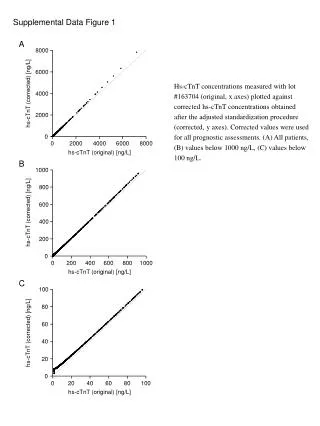
Comparative Analysis of Original and Corrected hs-cTnT Concentrations
This study compared hs-cTnT concentrations before and after adjustment to assess prognostic value in patients with different levels of biomarker. Supplemental Data: Figure 1 shows the data plotted for interpretation.

Comparative Analysis of Original and Corrected hs-cTnT Concentrations
E N D
Presentation Transcript
A 1000 8000 800 hs-cTnT (corrected) [ng/L] 6000 600 4000 400 0 2000 4000 6000 8000 hs-cTnT (original) [ng/L] B 200 2000 0 0 hs-cTnT (corrected) [ng/L] 0 200 400 600 800 1000 hs-cTnT (original) [ng/L] C 100 80 hs-cTnT (corrected) [ng/L] 60 40 20 0 20 40 60 80 100 0 hs-cTnT (original) [ng/L] Supplemental Data Figure 1 Hs-cTnT concentrations measured with lot #163704 (original, x axes) plotted against corrected hs-cTnT concentrations obtained after the adjusted standardization procedure (corrected, y axes). Corrected values were used for all prognostic assessments. (A) All patients, (B) values below 1000 ng/L, (C) values below 100 ng/L.