
Uploaded by
keith
1 SLIDES
128 VIEWS
10LIKES
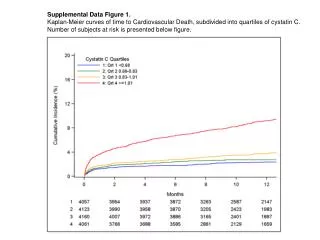
Kaplan-Meier Curves of Cardiovascular Death by Cystatin C Quartiles
DESCRIPTION
This supplemental data figure presents Kaplan-Meier survival curves illustrating the time to cardiovascular death, categorized into quartiles based on cystatin C levels. The number of subjects at risk is detailed below the figure, allowing for a comprehensive analysis of the relationship between cystatin C and cardiovascular mortality. These curves provide critical insights into how varying levels of cystatin C can influence patient outcomes, highlighting its potential as a prognostic biomarker.
Download
1 / 1
Download Presentation 
Kaplan-Meier Curves of Cardiovascular Death by Cystatin C Quartiles
An Image/Link below is provided (as is) to download presentation
Download Policy: Content on the Website is provided to you AS IS for your information and personal use and may not be sold / licensed / shared on other websites without getting consent from its author.
Content is provided to you AS IS for your information and personal use only.
Download presentation by click this link.
While downloading, if for some reason you are not able to download a presentation, the publisher may have deleted the file from their server.
During download, if you can't get a presentation, the file might be deleted by the publisher.
E N D
Presentation Transcript
Supplemental Data Figure 1. Kaplan-Meier curves of time to Cardiovascular Death, subdivided into quartiles of cystatin C. Number of subjects at risk is presented below figure.


More Related