Download
1 / 28
290 likes | 876 Views
Types of Measurement. Continuous Underlying continuum Index of amount Intermediate numbers make sense Discreet Is or is not Usually use only whole numbers. Scales of Measurement. What are the Rules for assigning numerals to objects? Nominal Ordinal Interval Ratio. Representing Data.

E N D
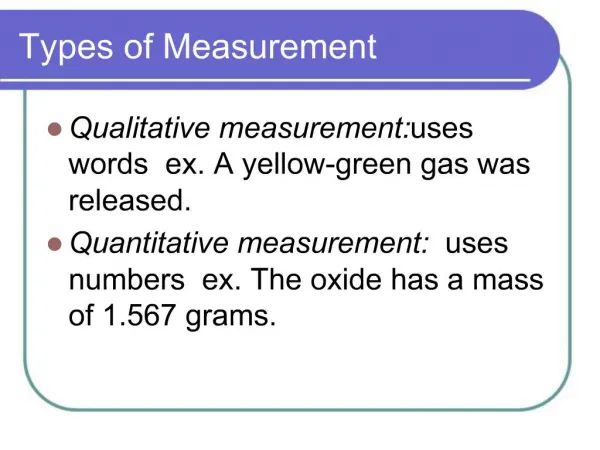
Types of Measurement • Continuous • Underlying continuum • Index of amount • Intermediate numbers make sense • Discreet • Is or is not • Usually use only whole numbers
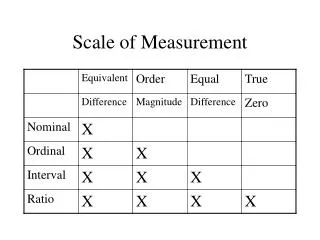
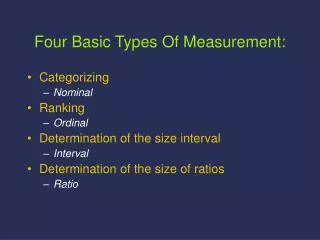
Scales of Measurement • What are the Rules for assigning numerals to objects? • Nominal • Ordinal • Interval • Ratio
Representing Data • Frequency Distribution • Grouped Frequency Distribution • Histogram • Bar Graph • Frequency Distribution
Measures of Central Tendency • Mean • Median • Mode
Measures of Variability • Range • Standard Deviation & Variance
Steps for Calculating Standard Deviation • Calculate the mean • Calculate each deviation score • Square each deviation score
S.D. Calculation (cont.) • Sum the deviation scores • Divide the sum of the squared deviations by the sample size. This is the variance • Calculate the square root of the variance. This is the S.D.
Shapes of Distributions • Skewness • The extent to which symmetry is absent (the tail tells the tale) • Positively skewed • M>Md>Mode • Negatively skewed • Mode>Md>M
Shapes of Distributions (cont.) • Whose class would you take? • The mean scores in both Prof. A’s & Prof. B’s sections of PSY 3601 were 75. • The scores in Prof. A’s class were distributed in a positively skewed manner. • The scores in Prof. B’s class were distributed in a negatively skewed manner.
Shapes of Distributions • You represent the teachers’ union in contract negotiations. The mean number of years of experience for your teachers is 18 (a veteran group). Teacher pay goes up with years of experience.You want to make a case that your teachers are underpaid. • What measure of central tendency would you report as average?
Shapes of Distributions • Kurtosis • The steepness of a distribution in its center • Leptokurtic • Mesokurtic • Platykurtic
Normal Curve • Bell-shaped, smooth, highest at center and tapers on both sides • Range from positive infinity to negative infinity • Symmetrical • Many variables, psychological & otherwise, distributions approximate normal distribution • Scores distributed normally are much easier to interpret than scores from other distributions.
Characteristics of the normal distribution • 50% of scores above and 50% below the mean • Mean, Median, & Mode are the same point • 68% of cases between 1 S.D. above and 1 S.D. below the mean • 95% of cases between 2 S.D. above and 2 S.D. below the mean
Normal curve (cont.) • Cumulatively • 2 % of cases < 2 S.D. below the mean • 16% of cases < 1 S.D. below the mean • 50% of cases < Mean • 84% of cases < 1 S.D. above the mean • 98% of cases < 2 S.D. above the mean • 99.9% of cases < 3 S.D. above the mean
Making sense of scores on psychological tests • Convert “raw” score to another type of score • Why are converted or transformed scores important? • Variability in tests: their format, length, people for whom they are intended. • Psychological tests may or may not have “right” & “wrong” answers. • Relative standing of individual in comparison to group
Percentiles • An expression of the percentage of people whose score on a test falls below a particular raw score; a converted score that refers to a percentage of test takers • Rank order information
Percentiles (cont.) • Advantages • Direct & clear picture • Easily communicated • Not influenced by the shape of the distribution • Always between 0 & 100 • Disadvantages • Ordinal scale-can’t do arithmetic operations • Not proportional in relationship to raw scores • Tend to bunch up in the middle • Overemphasize differences in the middle of the distribution • Underemphasize differences in the extremes
Standard Scores • Definition: A raw score that has been converted from one scale into another, the latter scale (1)having some arbitrarily set mean and standard deviation and (2) being more widely used and readily interpretable • Different systems of standard scores • Deviation scores
z Scores • Tells how many standard deviations a score is from the mean • The difference between a particular raw score and the mean divided by the standard deviation
z Scores (cont.) • Ease comparing performance on different tests • Can manipulate them mathematically (interval(?)) scale • Scores can range from approximately -3 to +3; M=0 & S.D.=1
z Scores (cont.) • Problems with z Scores: • Awkwardness of 0 & negative numbers • Dealing with decimals • Solution: • Use z Scores as building block for other Standard Scores • Different tests use different standard score systems. All based on z scores; tell you how many S.D.s from the mean.
z Score Conversion Formula:
Conversions (cont.) • Xnew = new standard score • S.D.new = desired & arbitrarily chosen standard deviation of new standard score • Mnew = desired & arbitrarily chosen mean of new standard score
T Scores • Mean = 50 • Standard Deviation = 10 • T 60 = z 1(1 S.D. > M) • T 65 = z 1.5 (1.5 S.D.>M) • T 40 = z ? • T 35 = z ?
Other Standard Scores • SAT & GRE • M=500, S.D.=100 • Deviation “IQ” Scores • Wechsler, etc. • M=100, S.D.=15 • Binet • M=100, S.D.=16
Stanines • Standard 9 • Divide normal distribution into 9 segments • Represented as numerals 1 through 9 • Each stanine 1/2 S.D. in width • Stanine 5 straddles mean from 1/4 S.D. to 1/4 S.D. above
Transformed scores • Linear Transformation: retains a direct linear relationship to original raw score; differences among standard scores parallels differences among raw scores • Nonlinear: when distribution is not normal; data manipulated to approximate normal curve: “normalized”; for comparing with tests from which scores may be normally distributed