1 / 11

8.2 . IEVADS STATISTIKĀ

8.2 . IEVADS STATISTIKĀ. Datu attēlošanas veidi. M_08_ 02_VM_01. Populārākie datu attēlošanas veidi. Tabula. Sektora diagramma. Līnij- diagramma. Stabiņu diagrammā. Kādus datu attēlošanas veidus var redzēt nākamajos attēlos?. Kurš un kāpēc Tev dod vairāk informācijas?. Lidosta.

Download Presentation

8.2 . IEVADS STATISTIKĀ

An Image/Link below is provided (as is) to download presentation Download Policy: Content on the Website is provided to you AS IS for your information and personal use and may not be sold / licensed / shared on other websites without getting consent from its author. Content is provided to you AS IS for your information and personal use only. Download presentation by click this link. While downloading, if for some reason you are not able to download a presentation, the publisher may have deleted the file from their server. During download, if you can't get a presentation, the file might be deleted by the publisher.

E N D

Presentation Transcript


  1. 8.2. IEVADS STATISTIKĀ Datu attēlošanas veidi M_08_02_VM_01

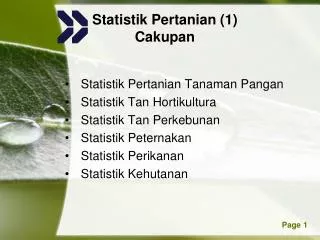
  2. Populārākie datu attēlošanas veidi Tabula Sektora diagramma Līnij- diagramma Stabiņu diagrammā

  3. Kādus datu attēlošanas veidus var redzēt nākamajos attēlos? Kurš un kāpēc Tev dod vairāk informācijas?

  4. Lidosta

  5. Valūtas kurss Valūtas kursu izmaiņas 30 dienās:

  6. Statistikas pārvaldes dati

  7. Latvijas iedzīvotāju nacionālais sastāvs

  8. Veselīgs uzturs

  9. Cik dažādus datu attēlošanas veidus vari redzēt nākamajā attēlā?

  10. Uzziņai: http://www.csb.gov.lv/csp/content/?cat=9650

More Related