Download

1 / 17
180 likes | 380 Views
INT 4843 Statistical Quality Control. Bruce Barnard Terry Parish Mark Tegeler. Quality. “Quality is inversely proportional to variability”. Montgomery(2001). Steps to Statistical Quality Control. Identify the process to be monitored. Identify the variable to be monitored.

E N D
INT 4843Statistical Quality Control Bruce Barnard Terry Parish Mark Tegeler
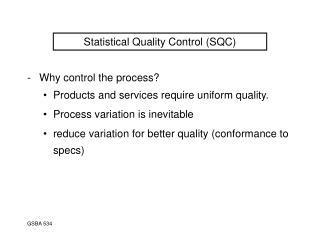
Quality “Quality is inversely proportional to variability”. Montgomery(2001)
Steps to Statistical Quality Control • Identify the process to be monitored. • Identify the variable to be monitored. • Measure historical data. • Construct an R chart and an Xbar chart. • Plot the data.
Steps to Statistical Quality Control • Evaluate the data looking for signals, trends and outliers. • Construct a revised control chart without the outliers. • Use revised control limits to predict process control. • Monitor the process.
Tomato Can Process (Histogram) • Data indicates a unimodal distribution • Central tendency is close to 22 oz. • The variability is relatively high
Decisions • The R chart has a point plotting outside the range. • The outlier was removed from the data. • The control limits were revised & replotted.
Evaluation of Control ChartsAction Signals • One or more points outside of the control limits • Two of three consecutive points outside of the two-sigma warning limits but still inside the control limits. • Four of five consecutive points beyond the one-sigma limits • A run of eight consecutive points one side of the center line • Six points in a row steadily increasing or decreasing.
Evaluation of Control ChartsAction Signals • Fifteen points in a row zone C (both above and below the center line). • Fourteen points in a row alternating up and down • Eight points in a row on both sides of the centerline with none in zone C. • An unusual or nonrandom pattern in the data. • One or more points near a warning or control limit
Process Capability (Cp & Cpk) • Cp = .4105 • Cpk = .626
Recommendations • Revise sampling techniques, insuring samples are collected at regular intervals ( 1 per hour) • Devise and implement a capability study • Consider use of scatterplot to study potential relationships (operator, source of inputs, etc.)