Supplemental Figure 1
10 likes | 81 Views
Supplemental Figure 1. A. B. H3Ac. H3K9Me3. H3S10P. Protein association (ratio to IgG ).

Supplemental Figure 1
E N D
Presentation Transcript
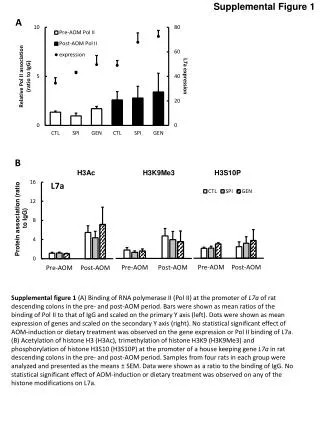
Supplemental Figure 1 A B H3Ac H3K9Me3 H3S10P Protein association (ratio to IgG) Supplemental figure 1 (A) Binding of RNA polymerase II (Pol II) at the promoter of L7aof rat descending colons in the pre- and post-AOM period. Bars were shown as mean ratios of the binding of Pol II to that of IgG and scaled on the primary Y axis (left). Dots were shown as mean expression of genes and scaled on the secondary Y axis (right). No statistical significant effect of AOM-induction or dietary treatment was observed on the gene expression or Pol II binding of L7a. (B) Acetylation of histone H3 (H3Ac), trimethylation of histone H3K9 (H3K9Me3) and phosphorylation of histone H3S10 (H3S10P) at the promoter of a house keeping gene L7a in rat descending colons in the pre- and post-AOM period. Samples from four rats in each group were analyzed and presented as the means ± SEM. Data were shown as a ratio to the binding of IgG. No statistical significant effect of AOM-induction or dietary treatment was observed on any of the histone modifications on L7a.


