Download
1 / 1
10 likes | 115 Views
High Frequency Ultrasound Monitoring of Structural Changes in Cells and Tissue Adam Tunis 1,2 , Anoja Giles 2 , David McAlduff 1,2 , David Spurrell 1,2 , Mehrdad Hariri 2 , Rama Khokha 1,2,3 , John Hunt 1,2 , Gregory Czarnota 2,4 , Michael Sherar 1,2 and Michael Kolios 1,4

E N D
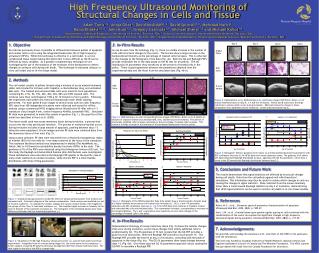
High Frequency Ultrasound Monitoring of Structural Changes in Cells and Tissue Adam Tunis1,2, Anoja Giles2, David McAlduff1,2, David Spurrell1,2, Mehrdad Hariri2, Rama Khokha1,2,3, John Hunt1,2, Gregory Czarnota2,4, Michael Sherar1,2 and Michael Kolios1,4 1 Department of Medical Biophysics, University of Toronto, Toronto, ON; 2 Ontario Cancer Institute, University Health Network, Toronto, ON; 3 Department of Laboratory Medicine and Pathobiology, University of Toronto, Toronto, ON; 4 Department of Mathematics, Physics and Computer Science, Ryerson University, Toronto, ON 1. Objective Our lab has previously shown it possible to differentiate between pellets of apoptotic and normal cells in-vitro using the integrated backscatter (IB) of high frequency ultrasound (HFUS). While this technique is effective in a cell model, in a more complicated tissue model making this distinction is more difficult as the IB can be affected by many variables. As a possible complementary technique we are investigating the use of the statistics of the envelope of the backscatter to detect changes occurring in cells during cell death. This technique is evaluated using an in-vitro cell model and an in-vivo tissue model. 3. In-Vitro Results As can be seen from the histology (Fig. 3), there is a visible increase in the number of cells with structural changes to the nuclei. The B-scans show a large increase in the backscattered intensity as the percentage of treated cells increases. This is reflected in the changes to the histograms of the data (Fig. 4a). Both the GG and Rayleigh PDFs provide reasonable fits to the data based on the KS test for all pellets. The GG distribution fit parameters show sensitivity to the percent of treated cells in the pellet. There is good agreement between the parameters obtained from the experimental data and the those from the simulated data (Fig. 4b-d). Figure 5: Digital photos (a-d), H&E staining (e-h), and B-scan images (FOV 8mm x 8mm) (i-l) of mouse mammary tissue on days 0, 3, 4 and 6 of involution. Photos and B-scans show the large reduction in volume which occurs during involution. H&E stain shows the change in tissue composition from epithelial cells to mostly fat. Arrows indicate alveolar ducts. Day 3 Day 0 Day 4 Day 6 Digital Photo b) a) c) d) H&E Stain e) g) h) f) 2.5% 0% 20% 100% 2. Methods The cell model consists of pellets formed using a mixture of acute myeloid leukemia (AML) cells treated for 24 hours with Cisplatin, a chemotherapy drug, and untreated AML cells. The treated and untreated AML cells were mixed to form populations containing 0%, 2.5%, 5%, 10%, 20%, 40%, 60%, 80% and 100% treated cells. The mixtures were then centrifuged at 1942 g for 10 minutes to form a pellet. Following the experiment each pellet was fixed and hematoxylin-eosin (H&E) staining performed. For each pellet B-scan images of several slices and raw radio frequency (RF) data from 100 independent locations were collected and stored for offline analysis using a commercial HFUS imaging device (VisualSonics VS-40b) with a f/3 transducer (focal length 9 mm, centre frequency 40 MHz, bandwidth 95%). Simulated RF data were generated to model the system in question (Fig. 1), the specifics of the model are described in Hunt et al. (2002). The tissue model used was mouse mammary tissue during involution, a process that occurs over the 6 day period post-lactation. The process of restructuring that occurs during involution includes a large amount of apoptosis, peaking between days 1-3. Using the same equipment, B-scan images and raw RF data were collected daily from the mammary tissue of four mice (Fig. 2). Using custom software, RF data were extracted from a relatively homogeneous region of interest (ROI) 4-6 mm wide by 1 mm deep centered at the focus of the transducer. The maximum likelihood method was implemented in Matlab (The MathWorks Inc., Natick, MA) to fit theoretical probability density functions (PDFs) to the data. The goodness of fit of the PDFs was evaluated using the Kolmogorov-Smirnov (KS) test. For this study the Rayleigh and Generalized Gamma (GG) distributions were investigated. These distributions were selected as the Rayleigh PDF applies to the specific case of many small scatterers at random locations, while the GG PDF is a more flexible distribution with three fitting parameters. Figure 3: H&E staining (a-d) and corresponding B-scan images (FOV 8mm x 8mm) (e-h) of pellets of mixtures of Cisplatin treated and untreated AML cells, labelled as percent treated. The portion of structurally modified cells increases noticeably as the percentage of treated cells increases. This results in a visible increase in the intensity of the ultrasound backscatter from the pellet. H&E Stain B-scan 40 MHz a) b) c) d) l) j) k) i) B-scan 20 MHz h) e) f) g) a) b) Figure 6: Kolmogorov-Smirnov goodness of fit values (a) and Generalized Gamma fit parameters with 95% confidence intervals (b) for HFUS data from mouse mammary tissue. The goodness of fit shows the data being most Rayleigh-distributed at day 2, agreeing with the fit parameters which show a trend in the GG towards the Rayleigh distribution between days 2-3. Kolmogorov-Smirnov Goodness of Fit Gamma a, c & v Parameters - Gamma a - Gamma v - Gamma c - Rayleigh - Gen. Gamma - Significance Level a) b) Figure 4: Histograms of the HFUS backscatter data from pellets show a trend towards a broader peak at a higher intensity as the percent of treated cells increases (a). GG a, c and v fit parameter estimates with 95% confidence intervals (b, c & d) for HFUS data from mixtures of Cisplatin treated and untreated AML cells and simulated data. The a parameter increases, corresponding to increases in the image brightness. The c and v parameters show sensitivity to even small changes in the percentage of treated cells in the pellet. Gamma a Parameter Histograms for Data from Pellets KS Value [A.U.] Gamma a & v [A.U.] Gamma c [A.U.] - Pellet - Simulation - 0% - 2.5% - 20% - 40% - 60% - 100% Gamma a (simulation) [A.U.] Number of Counts [A.U.] Gamma a (pellet) [A.U.] Day of Involution Day of Involution Percent Treated Intensity [A.U.] c) d) Gamma c Parameter Gamma v Parameter 5. Conclusions and Future Work The results demonstrate that signal statistics are affected by structural changes during cell death. Data from the cell pellets agreed well with theoretical simulations. This information may thus be useful to isolate which changes in cells are causing the changes in signal statistics. Data collected from the mouse mammary tissue show a trend toward Rayleigh statistics at day 2 of involution, demonstrating that HFUS signal statistics can be used to monitor cell death in in-vivo tissue models. Figure 1: Simulated data generated to model the effect of ultrasound backscatter from treated and untreated cells. Schematic diagram of the nuclear condensation. Each nucleus was modelled as a set of 16 point scatterers. To simulate the cellular changes the nuclear volume shrinks, then fragments into groups of four, then 16 individual scatterers (a). The modelled signal increases in intensity as the level of disorder of the scatterers increases (b). The histograms of the simulated signals show large differences between the two simulated populations (c). a) Histograms for Simulated Signals c) - Pellet - Simulation - Treated - Untreated Gamma c [A.U.] Gamma v [A.U.] Number of Counts [A.U.] - Pellet - Simulation b) Intensity [A.U.] 6. References Kolios, M.C., et al., Ultrasonic spectral parameter characterization of apoptosis.Ultrasound Med Biol, 2002. 28(5): p. 589-97. Hunt, J.W., et al., A model based upon pseudo regular spacing of cells combined with the randomisation of the nuclei can explain the significant changes in high-frequency ultrasound signals during apoptosis.Ultrasound Med Biol, 2002. 28(2): p. 217-26.’’ Percent Treated Percent Treated Figure 2: VisualSonics VS-40b high frequency ultrasound scanner (a), used for both pellet and tissue experiments. A magnified view of a mouse being imaged (b), the arrow points to the transducer. c) Screen capture of opened RF data file showing a homogeneous ROI from mouse mammary tissue. The dark region to the left of the ROI is a lymph node. 4. In-Vivo Results Representative histology of mouse mammary tissue (Fig. 5) shows the cellular changes that occur during involution, as the tissue changes from mostly epithelial cells to predominantly fat. The KS goodness of fit test reveals that the GG PDF provides a good fit at all time points, while the Rayleigh PDF provides a much poorer fit. The Rayleigh PDF provides the best fit at day 2 of involution, coinciding with the peak of apoptosis in the tissue (Fig. 6a). The GG fit parameters show large changes between days 1-3 (Fig. 6b). Over these days the GG fit parameters approach values causing the GG PDF to resemble a Rayleigh PDF. a) b) c) 7. Acknowledgements We gratefully acknowledge the assistance of Dr. John Hunt of OCI/PMH for his assistance with the simulations. This work was funded by Canadian Institutes of Health Research, Natural Sciences and Engineering Research Council of Canada and The Whitaker Foundation. The HFUS scanner was purchased with funds from the Canada Foundation for Innovation. 1mm 2mm