Strain-Probe Microarray Hybridization Signal Intensity Analysis
This supplementary figure displays a box plot of normalized signal intensity from strain x probe microarray hybridizations grouped by the WMM value. Median values are shown by black square symbols, with quartiles represented by box extremities, extreme values by horizontal bars, and outliers by black round symbols. It categorizes high and low signals, along with expected and non-expected hybridizations.

Strain-Probe Microarray Hybridization Signal Intensity Analysis
E N D
Presentation Transcript
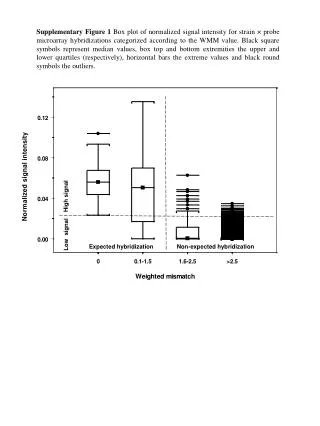
Supplementary Figure 1 Box plot of normalized signal intensity for strain × probe microarray hybridizations categorized according to the WMM value. Black square symbols represent median values, box top and bottom extremities the upper and lower quartiles (respectively), horizontal bars the extreme values and black round symbols the outliers. High signal Low signal Expected hybridization Non-expected hybridization