Download
1 / 13
140 likes | 264 Views
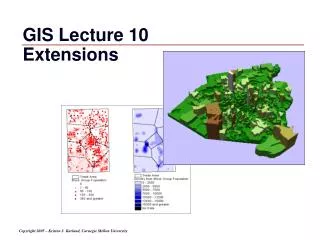
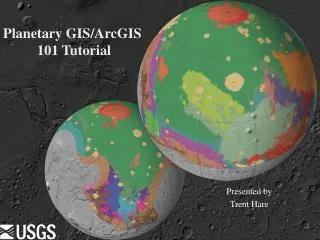
Marine GIS Applications (ArcGIS) padmanabham Jijjavarapu INCOIS. World Map (Geographic). Map Projections and Coordinate Systems. In this exercise we under stand how projections can distort areas and distances. As per the exercise we have taken the following projection systems for understanding

E N D
Marine GIS Applications (ArcGIS)padmanabhamJijjavarapuINCOIS
Map Projections and Coordinate Systems • In this exercise we under stand how projections can distort areas and distances. As per the exercise we have taken the following projection systems for understanding • Mercator projection • preserves shapes but distorts areas. • Sinusoidal projection shapes are distorted but the areas are preserved
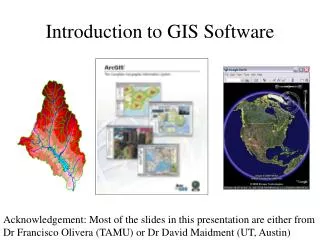
Create Base Map in Arc Map The following are the tasks that involves in the preparation of the base maps • Area of Interest • Bathymetry data preparation from GEBCO • Coastline • EEZ layer (both line and polygon coverage) • Sediment Thickness data
Introduction to Ocean Data View • Creating Data Collection from the World Ocean Database URL • Export Marine Data from the Ocean Data View Creating ODV Collections from WOD Data • Here we understand how to use the ODV effectively for data profiling from the WOD • We concentrated on Physical Oceanographic Measurements such as salinity and temperature. • Profiler map generation for the Liberia was done
Interpolating surfaces • Utilization of ArcMap Spatial Analyst extension to interpolate the summer and winter temperature point data to a raster grid for Liberia
Rendering Raster Data & Calculation • We explored the usage of color ramp, Style manager and classification • performed spatial analysis operations using Map Algebra to create new analysis grids
Working with NetCDF • SST data preparation • Loading of NetCDF data in Arc Map and analyzing the sea surface Temperatures
Plotting Vector Arrows from U and V Component Grids • Installation and utilization of the Marine Geospatial Ecology Tools (MGET) • Plotting of U-V components of climatology wind data
Acknowledgements • IOC-IODE • INCOIS • Ocean Teacher • Mr Greg REED • Mr R S MAHENDRA • Ms. Claudia Delgado