Download
1 / 6
60 likes | 79 Views
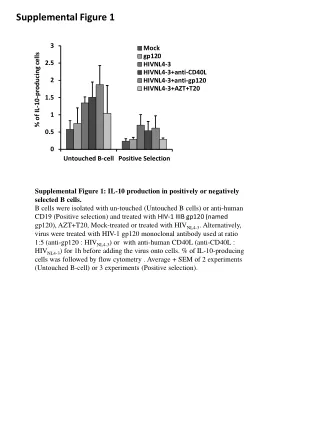
Supplemental Figure 1. Supplemental Figure 1: IL-10 production in positively or negatively selected B cells.

E N D
Supplemental Figure 1 Supplemental Figure 1: IL-10 production in positively or negatively selected B cells. B cells were isolated with un-touched (Untouched B cells) or anti-human CD19 (Positive selection) and treated with HIV-1 IIIB gp120 (named gp120), AZT+T20, Mock-treated or treated with HIVNL4-3. Alternatively, virus were treated with HIV-1 gp120 monoclonal antibody used at ratio 1:5 (anti-gp120 : HIVNL4-3) or with anti-human CD40L (anti-CD40L : HIVNL4-3) for 1h before adding the virus onto cells. % of IL-10-producing cells was followed by flow cytometry . Average + SEM of 2 experiments (Untouched B-cell) or 3 experiments (Positive selection).
Supplemental Figure 2 A B * * Supplemental Figure 2: TGFβ1 and IL-12 production. B cells were treated with CD40L/IL-4 ; HIV; CD40L/IL-4/HIV; CpG/CD40L/LPS and CpG/CD40L/LPS/HIV for 48h. Cells were also Mock-treated (Mock) or not treated (NT). TGFβ1 (A) and IL-12 (B) were quantified in supernatant of cell cultures. Average + SEM of 4 experiments. *=p<0.05 when comparing Mock-treated condition versus treated condition.
Supplemental Figure 3 B Activated EC+ CpG/CD40L/LPS/HIV B cells Activated EC+ CpG/CD40L/LPS B cells Activated EC+ CD40L/IL-4/HIV B cells Activated EC+ CD40L/IL-4 B cells Activated EC+ Mock B cells Activated EC+ NT B cells Activated EC+ HIV B cells Non-activated EC Activated EC count CD4 CD8 CFSE A B
Supplemental Figure 3: Flow cytometry gates and inhibition of the EC proliferation experiment. Proliferation of autologous effector cells (EC) treated with CFSE and co-cultured with NT or treated-B cells (ratio Treated B-cell:EC of 2:1) at day 3 post-co-culture. (A) Viable cells were analyzed for CD4 or CD8 expression. (B) Histograms of CD4+ and CD8+ T-cell proliferation analyzed by flow cytometry following the loss of CFSE fluorescence. One representative experiment out of 5 is showed. Numbers represent the percentage of proliferation for CD4+ (CD4p) or CD8+ (CD8p) T cells. NT: non treated cells.
Supplemental Figure 4 Activated EC+ CpG/CD40L/LPS/HIV B cells Activated EC+ CpG/CD40L/LpS B cells Activated EC+ CD40L/IL-4/HIV B cells Activated EC+ CD40L/IL-4 B cells Activated EC+ Mock B cells Activated EC+ NT B cells Non-activated EC Activated EC+ HIV B cells Activated EC count CD4 CD8 TNF-α
Supplemental Figure 4: Flow cytometry gates and the inhibition of the EC TNFα expression experiment. Intracellular TNFα expression of autologous effector cells (EC) co-cultured with non treated (NT) or treated-B cells (ratio Treated B-cell:EC of 2:1) at day 3 post-co-culture. (A) Viable cells were analyzed for CD4 or CD8 expression. (B) Histograms of intracellular TNFα expression analyzed by flow cytometry. One representative experiment out of 6 is showed. Numbers represent the % of TNFα expression in CD4+ (CD4t) or CD8+ (CD8t) T cells .


