Download
1 / 31
310 likes | 338 Views
Learn about the principles of cartography and effective techniques for communicating spatial information. Explore different map types like dot density, proportional/graduated symbol, and choropleth maps. Understand cartographic elements, layout, semiotics, and symbol systems. Discover design considerations for creating clear and legible maps.

E N D
Cartography: Communicating Spatial Information Scott Bell GIS Institute
GIS Output and Information Communication • What do we want to communicate? • How can it be communicated? • http://blogs.esri.com/esri/arcgis/2011/10/28/design-principles-for-cartography/ • Google: ESRI design principles
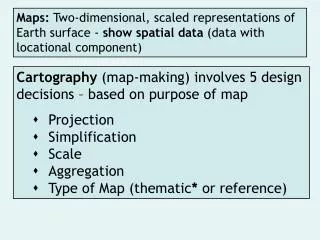
What is Happening on a Map? • Geography/Space is being simplified • Non-geographic information is being simplified
Map Types • Let’s see what types of maps we can make • Dot density • Proportional/graduated symbol • choropleth
Dot Density Maps • Portraying numeric/count data with dot density • Dots coincide with enumeration area • DO NOT represent location of observation • Dots represent a CONSTANT quantity • Generalization is associated with aggregation • Use with quantities of observations
Proportional/Graduated Symbol • Symbol size varies in proportion to attribute value • “proportional” implies a continuous range of symbol sizes • Also called Graduated Symbol and Variable Symbol • “graduated” implies symbol size is associated with a range of attribute values • Used with ratio data that has a range of values absent of outliers
Choropleth Maps • Portraying statistical data with area symbols • Area symbols coincide spatially with and represent data values for enumeration zones • Features in the same class should be similar and should be symbolized similarly • Features in different classes should be dissimilar and should symbolized differently
Thematic maps - Choropleth Maps created by Tayyab Shah, 2011.
Cartography • Maps as communication • Cartographic/Map elements • Map Layout • Cartographic Semiotics • Symbols • Typography
Cartography as Communication • Maps as visual communication • Special purpose language • Grammar and syntax • Related to graphical communication • Maps as symbolic • Generalizations • representations
Bertin, J. (1983). Semiology of graphics. Madison, Wis.: University of Wisconsin Press. Cleveland, William S. 1985. The Elements of Graphing Data. Monterey, CA: Wadsworth. Schmid, Calvin F. 1983. Statistical Graphics: Design Principles and Practices. New York: John Wiley and Sons. Schmid, Calvin F. and Schmid, Stanton E. 1979. Handbook of Graphic Presentation, 2nd ed. New York: John Wiley and Sons. Tufte, Edward R. 1983. The Visual Display of Quantitative Information. Cheshire, CT: Graphics Press. Tufte, Edward R. 1990. EnvisioningInformation. Cheshire, CT: Graphics Press.
Designing Maps Well • Clarity and Legibility • Figure – Ground • Balance • Visual Hierarchy • Contrast • Audience, Venue, Intent, and Format
Clarity and Legibility • Easy to read • Symbols, legends, themes • Colors, patterns, etc. used to differentiate distinct symbols and elements • Individual elements should be larger than required for regular vision • Focus of attention
Map Layout • Visual Hierarchy • Location on map • Size • Prominence • Balance • Experimentation • Defensibility of each element
Cartographic Elements • Elements found on almost all maps • Distance or Scale • Direction • Legend • Sources of information and how processed
Cartographic Elements • Selectively use elements • Neatlines • Locator maps • Inset maps • Index maps
Cartographic Semiotics • Theory of signs • Referent and symbol (or sign) • Relationship between the two • Cartographers semiotic toolbox • Visual • Other…
Symbol Systems • Levels of data • Nominal, ordinal, interval, ratio • Feature types • Points, lines, areas • Symbol systems for each • Typography and lettering
Typography and Text • Content and Form “Colonies controlled or ruled by the Spanish Empire on the eve of the Spanish-American War” or “The Spanish Empire in 1898” Sans serif vs. variable fontstyles
7 Design Considerations • know your subject • decide on an appropriate scale • decide on volume of data to be presented (esp. # of areal units) • data preprocessing (intensive data) • data classification • areal symbolization • legend design