Download
1 / 28
300 likes | 498 Views
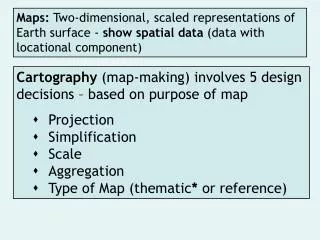
Maps: Two-dimensional, scaled representations of Earth surface - show spatial data (data with locational component). Cartography (map-making) involves 5 design decisions – based on purpose of map Projection Simplification Scale Aggregation

E N D
Maps: Two-dimensional, scaled representations of Earth surface - show spatial data (data with locational component) Cartography (map-making) involves 5 design decisions – based on purpose of map Projection Simplification Scale Aggregation Type of Map (thematic* or reference)
THEMATIC MAPS – depict characteristics of places Categorical type - Depict areas that are different in kind - Use several distinct colors to show different categories desert forest tundra Examples: climates, religions Choropleth type - Depict areas that are different in amount - Use shades of similar colors to show different values high value medium low value Examples: population density, literacy rates
Example of “choropleth map” Human Development Index (HDI) Rankings Includes GNI/PPP, Literacy, and Life Expectancy Which regions have high HDI? Which regions have low HDI? Which places are exceptions?
Isoline type(Average Daily Solar Radiation) Lines connect points of equal value Dot Density type(Wisconsin Acreage in Potatoes) Each dot represents a frequency of mapped variable
Proportional Symbol Map (Graduated Circle type) Size of symbol varies in relation to frequency or intensity of the mapped variable Proportional Symbol Map (Flow Vector type)
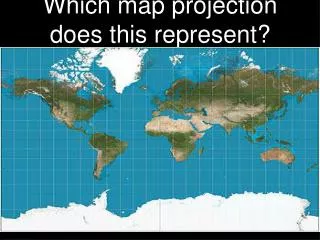
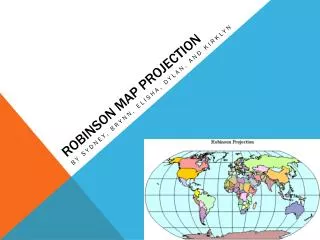
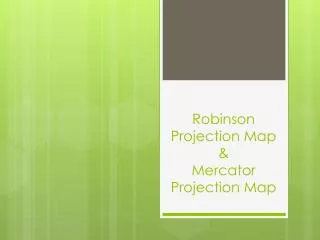
Sample Map Projections Systematic methods of transferring a spherical surface to a flat map Distortion must occur in either size, shape, distance, or direction – all projections are compromises Mercator Robinson Polar
Equal-Area projections best where purpose is to compare distributions of a variable between places (They distort shapes to make sizes correct.) What impressions do you get from this map?
The ratio of map distance to earth distance, measured in the same units Map Scale smaller scale Sample Area CoveredFraction ScaleVerbal Scale World 1:78,000,000 1 in = 1,250 mi No. America 1:36,000,000 1 in = 570 mi Central U.S. 1: 4,000,000 1 in = 64 mi AAA Colo map 1: 1,267,200 1 in = 20 mi larger scale Smaller-scale shows more land area in less detail. Used to show global patterns. Larger-scale shows less land area in more detail. Used on local maps.
The scale at which one analyzes an issue is critical DIA – Only major U.S. airport built since 1980 At the national scale, why did the location of this airport make sense? At the local scale, why was it necessary to locate the airport where it is?
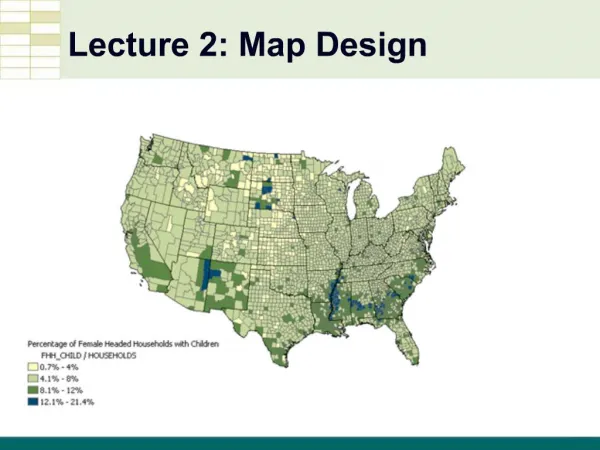
Map Aggregation The level of detail for dividing a thematic map into geographic units Ranges from coarse divisions (e.g., by countries) to fine divisions (e.g., by zip codes) Percent of 1990 pop age 25+ with bachelor's degree Data aggregated by State
Percent of pop age 25+ with bachelor's degree (1990) Note what information is lost at higher levels of aggregation Aggregated by State (northeast close-up) Aggregated by County (WV, MA)
State results, by land area County results, by land area State results, by population County results, by population 2004 Presidential Election Red = Bush; Blue = Kerry Source: M. Gastner, C. Shalizi, and M. Newman, University of Michigan http://www-personal.umich.edu/~mejn/election/
2004 Presidential Election Red = Solidly Bush (70% +) Purples = divided … redder = Bush majority; bluer = Kerry majority Blue = Solidly Kerry (70%+) By land area By population Source: M. Gastner, C. Shalizi, and M. Newman, University of Michigan http://www-personal.umich.edu/~mejn/election/
Spatial Thinking (Phil Gersmehl, Research in Geographic Education, 2006)
Pattern Analysis: Density vs. Dispersion Which square mile has the higher density, (a) or (b)?
Various Pattern Arrangements What phenomena could explain the patterns shown in A, B, and C?
Quick mapping activity – example of identifying changes in a spatial pattern, reasons for the changes, and consequences of these changes With a partner, map the following (on the same map): 1. Use a diamond symbol for the cities in which there was a Major League Baseball team in 1952 (16 teams). 2. Use a different symbol for the locations of MLB teams in 2007 (30 teams). Coors Field
Connections What kinds of things are symbolized by lines on this map?
Combination of climate, agriculture, and industry explains population density patterns Where are some patterns that illustrate this?
Denver metro area How does this map illustrate the aura or zone of influence for Denver? How are hierarchies symbolized on this map? For which kinds of services does Denver’s aura extend beyond this map?
Where could you define a region of “Elvis-lovers”? Where are the exceptions? Where are the outliers?
Compare the Pacific coasts of North and South America Which places have analogous climates?
Middle & South America Agricultural Regions (left) and Population Density (below) Spot any spatial correlations?
TURKIC(Altaic Language Family) Diversity, exceptions, and edges can make for interesting case studies or examples IRANIAN(Indo-European Language Family) SEMITIC(Afro-Asiatic Language Family)
Turkey Knowledge of cultural regions, boundaries, and transitions is necessary for understanding conflicts Syria Iran Jordan Iraq Ethnic Groups Saudi Arabia Kuwait Iraq’s population is 29 million: sixty percent are Shi’a Arab, mostly in the south. Sunni Arabs are concentrated in the center (western Iraq is sparsely populated). Over 4 million Iraqis in northern Iraq are Kurdish. Baghdad is a transition zone.