Download
1 / 22
220 likes | 377 Views
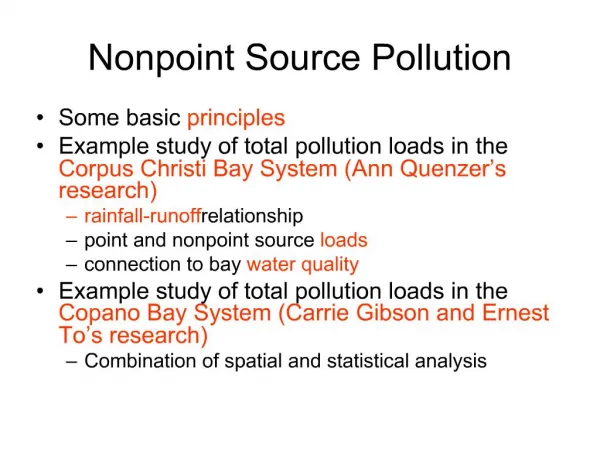
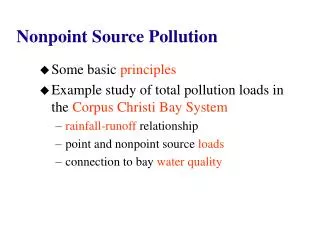
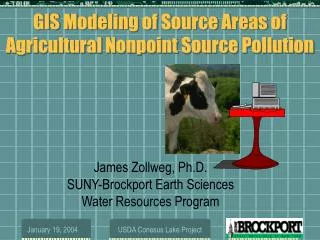
GIS Modeling of Source Areas of Nonpoint Source Pollution. James Zollweg, Ph.D. SUNY-Brockport Earth Sciences Water Resources Program Geographic Information Systems Program. Overview. Brief Biography Mapping and Illustration Using GIS Computation of P-Index

E N D
GIS Modeling of Source Areas of Nonpoint Source Pollution • James Zollweg, Ph.D. • SUNY-Brockport Earth Sciences • Water Resources Program • Geographic Information Systems Program USDA Conesus Lake Project
Overview • Brief Biography • Mapping and Illustration Using GIS • Computation of P-Index • Runoff and Soil Moisture Modeling with SMR • Hydrologic and Chemical Controls on P Export • previous results • new directions USDA Conesus Lake Project
Overview • Brief Biography • Mapping and Illustration Using GIS • Computation of P-Index • Runoff and Soil Moisture Modeling with SMR • Hydrologic and Chemical Controls on P Export • previous results • new directions USDA Conesus Lake Project
Brief Biography • 1994: Ph.D. (Cornell University) – “Effective Use of GIS in Rainfall-Runoff Modeling” • 1993-96: USDA – ARS - Pasture Systems and Watershed Management Research Lab – “Optimizing Nutrient Management to Sustain Agricultural Ecosystems and Protect Water Quality” • 1996-present: SUNY-Brockport – GIS and Water Resources (wetlands, flood forecasting) USDA Conesus Lake Project
Overview • Brief Biography • Mapping and Illustration Using GIS • Computation of P-Index • Runoff and Soil Moisture Modeling with SMR • Hydrologic and Chemical Controls on P Export • previous results • new directions USDA Conesus Lake Project
Mapping / Illustration Using GIS • Reports and Presentations • Public information • www.blackcreekwatershed.org • Data Explorations • Visualization • discovery • insight USDA Conesus Lake Project
Mapping / Illustration Using GIS USDA Conesus Lake Project
Overview • Brief Biography • Mapping and Illustration Using GIS • Computation of P-Index • Runoff and Soil Moisture Modeling with SMR • Hydrologic and Chemical Controls on P Export • previous results • new directions USDA Conesus Lake Project
Soil Erosion Irrigation Erosion Runoff Class Soil P-Test P Fertilizer Appl. Rate P Fertilizer Appl. Method Organic P Source Appl. Rate Organic P Source Appl. Method Computation of P-Index • Preservation of spatial variability • Computational efficiency • Visualization of results • Facilitates improved understanding of physical interactions Phosphorus Index USDA Conesus Lake Project
Overview • Brief Biography • Mapping and Illustration Using GIS • Computation of P-Index • Runoff and Soil Moisture Modeling with SMR • Hydrologic and Chemical Controls on P Export • previous results • new directions USDA Conesus Lake Project
Runoff and Soil Moisture Modeling with SMR • Variable Source Area Hydrology • Critical Source Areas for Nonpoint Source Pollution USDA Conesus Lake Project
Runoff and Soil Moisture Modeling with SMR • SMR – The Soil Moisture Routing Model • Product of Zollweg’s Thesis • GIS is the Ideal Environmental Modeling Platform • Spatially-distributed, Physically-based USDA Conesus Lake Project
Runoff and Soil Moisture Modeling with SMR Private Function HM_NeighborFlow(sStorage As String, _ pInterflowRaster As IRaster, ierr As Integer) As Boolean '----------------------------------------------------------------------------- ' The storage is adjusted for the amount leaving, the interflow and the amount ' entering from neighbor cells. The maps north, northeast, east, southeast, ' south, southwest, west and northwest represent the fraction of flow heading ' in 'that' direction from the current cell. Therefore to find the amount ' entering the current cell one needs to look at the neighbor cells and the ' corresponding maps which point to the current cell. For example, if the ' current cell is (i,j) and one looks to the north (i-1,j) one would use the ' south map to get the fraction of flow since the current cell is south of its ' north neighbor. ' --------------------------------------------------------------- ' | cell: (i-1, j-1) | cell: (i-1, j) | cell: (i-1, j+1) | ' | map: southeast | map: south | map: southwest | ' --------------------------------------------------------------- ' | cell: (i-1, j) | cell: (i, j) | cell: (i+1, j+1) | ' | map: east | map: none | map: west | ' --------------------------------------------------------------- ' | cell: (i+1, j-1) | cell: (i+1, j) | cell: (i+1, j+1) | ' | map: northeast | map: north | map: northwest | ' --------------------------------------------------------------- • Coded and Running in Lennon Hall Using Visual BASIC within ArcGIS 8.2 • Complete Control of Code • Easy to Integrate Additional Environmental Modeling Concepts USDA Conesus Lake Project
Overview • Brief Biography • Mapping and Illustration Using GIS • Computation of P-Index • Runoff and Soil Moisture Modeling with SMR • Hydrologic and Chemical Controls on P Export • previous results • new directions USDA Conesus Lake Project
(1996) USDA Conesus Lake Project
Brown Watershed – Tributary of WD38, Klingerstown, PA USDA Conesus Lake Project
Overview • Brief Biography • Mapping and Illustration Using GIS • Computation of P-Index • Runoff and Soil Moisture Modeling with SMR • Hydrologic and Chemical Controls on P Export • previous results • new directions USDA Conesus Lake Project
More Concepts to Try • Chemical dynamics of P Export • Transport processes • Erosion modeling and sediment transport • Pathogen transport USDA Conesus Lake Project
Goals • Support “mechanics” of project • Better understanding of watershed P dynamics • Continue my work and achieve mutual benefit! USDA Conesus Lake Project