Download
1 / 38
380 likes | 528 Views
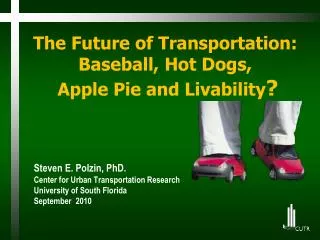
Steven E. Polzin, PhD. Center for Urban Transportation Research University of South Florida September 2010. The Future of Transportation: Baseball, Hot Dogs, Apple Pie and Livability ?. Based on comments from : 9th Annual New Partners for Smart Growth:

E N D
Steven E. Polzin, PhD. Center for Urban Transportation Research University of South Florida September 2010 The Future of Transportation: Baseball, Hot Dogs, Apple Pie and Livability?
Based on comments from : 9th Annual New Partners for Smart Growth: Building Safe, Healthy, and Livable Communities February 2010 And TRB Executive Committee Retreat “Red Meat” Session on Livability June 2010 Disclaimer: The observations are those of the author.
Some observations on travel behavior Some observations on transportation and land use. Outline
While the level of understanding and the amount of data regarding travel behavior have never been better. We haven’t been able to predict Who will win the next election, Which movie or TV show will be popular, What will be the hot Christmas gift, or, Which stocks (if any) will do well this year. Therefore we shouldn’t apologize for uncertainty regarding future travel or land use forecasts. But we should plan for uncertainty. Uncertainty in The Future
Social and Economic Interactions Create Demand for Travel • Travel is fundamental to the human desire to interact and socialize. • Travel enables economic interaction and the transportation of products and is fundamental to the functioning of the economy. • Growth in income and knowledge fuel the desire to become more specialized in employment, social interactions, consumption and time use. • This creates demand for more travel. Time • Specialization in • Employment • Consumption • Socialization • Time use • Growth in • Person Travel • Commerce • Communication • Growth in • Income • Knowledge Polzin, CUTR 2010
I’m not going to Disney. I’m going to stay home and watch the Disney Channel on the Big Screen Americans’ Mobility Aspirations? First thing I’m going to do is sell my big pickup truck and go for a walk I can’t wait to cancel my trip for the family reunion and move to a small condo downtown
Conceptual Framework for Thinking AboutTravel Demand Legal/Political Climate Culture Technology Security Economy Socio-Demographic Conditions Household/Person Characteristics • Income/wealth levels and distribution • Age/activity level • Culture/values • Racial/ethnic composition • Immigration status/tenure • Gender • Family/household composition • Housing location Business, Governance, Institutional Context • Scale of activity concentration • Economic structure of service delivery TravelDemand • Local person travel • Tourism/long trips • Freight • Commercial Travel Land Use Pattern • Regional/national distribution • Density • Mix of land uses • Urban form • Urban design • Contiguousness of development Transportation Supply/Performance • Modal Availability • Modal Performance • Cost • Speed/congestion • Safety, security • Reliability • Convenience • Image, etc. • Multi-tasking opportunities Polzin, CUTR 2009
Factors Contributing to US VMT Growth 1977-2001 Source: CUTR analysis of NHTS and NPTS
NPTS and NHTS Work Trip Walking Mode Shares Walk is 10.95% of all trips in 2008
Census Work Trips Carpooling Mode Share Source: U.S. Census Bureau, ACS
Person Miles of Travel per Hour of Travel (speed, all trips)
Declining Zero-Vehicle Households Source: CUTR analysis of NHTS ,NPTS,U.S. Census Bureau and 2002-08 ACS
Transportation/Land and Multimodal Thinking are Not New Officials at all levels of government are demonstrating an increasing awareness of the need for balanced transportation systems. The Federal Housing bill recently passed by Congress provides for emergency loans to communities for rail, bus , subway and other facilities …. State and local government are also giving increased attention to the matter of improving transit service by coordination with other modes. Wilbur S. Smith, ASCE Annual Meeting October 1961
“They said we need high density to make public transit work. “ “No, they said we need public transit to make high density work.”
Social, Professional, and Commerce Relationships are Less Place Based • Improved transportation (speed, cost, safety, choice) • Improved communications • Shorter tenure (jobs and housing) • Greater work force participation (social relationships less likely to be made over the picket fence or on the front porch) • Government/business replacing neighbors as safety net • Economy of scale factors challenge neighborhood-scale businesses and enterprises. (Technology and government regulation enhance the strength of economy of scale. )
Activity Scale and Distribution • The average size of an elementary school in the U.S. has grown from 155 students in 1950 to 445 in 2008. • There are 6000 fewer grocery stores in America in 2010 compared to 2001. • In 1970, there were 34 hospitals per million persons. In 2005 there were 24. • In 1970, there were 30,800 car dealerships. In 2008 there were 20,770. In 2011 there will be far fewer.
Do Business Economics Contradict Travel Minimization • 1940 - Went to the Doctor • 2010 - Went to the general practitioner, referred you to the specialist, sent to lab, scanning center, pharmacist, and the physical therapist (and not the closest one but the one covered by your health plan).
Commuting • Work trip commute appears to be well under 20% of trips and travel. • Nearly 30% of households have no workers or no commuters (workers work at home). • Fees, homestead tax rules, upside down mortgages, lack of portability of mortgages, etc. impede moving to minimize work trip length.
Impact of Density Impact of Density • Future high density residents may not behave as in the past • Income • Vehicle ownership
Where We Live and Where We’d Like to Live by community type Note: “Don’t know/Refused” responses are not reported Source: Pew Research Center, January 2009
Thus Future Travel is: • Travel Desire • Population • Real Income • Wealth • Value of Time ? • System Supply: • Modes • Speeds • Costs • Land Use • Density • Mix Energy Costs
Comments on Non-Urban Travel? • One vacation is equivalent to up to a 10 mile per day longer commute • How does city rebuilding compare to other mobility accommodating strategies? (Is a country that won’t raise gas taxes a dime willing to transform urban America?) • Managing regional growth versus urban growth.
Funding Transportation I Explained to my banker that if I had money for a new SUV, boat, motor, trailer, fishing gear and gas -- I could bring home free fish for dinner. How could you afford this nice transportation?
$100,000 worth of Tata Nanos Steven E. Polzin, Ph.D. Center for Urban Transportation Research 813-974-9849 polzin@cutr.usf.edu
Future Travel Demand in Hillsborough County: How Much Demand Could be Handled by Rail? Based on DailyPerson Miles of Travel (PMT) New travel by vehicle 2025 Portland LRT Dallas LRT All Other U.S. LRT Salt Lake LRT Denver LRT Transit 2005 New Transit 2025 The total travel on all the U.S. LRT systems is equivalent to about 1/3 of the expected growth in travel in Hillsborough County. Person travel by vehicle 2005 Source: NTD, Hills. MPO 2025 LRP
Top National Transportation Priority Economic Development Intelligent Transportation Efficiency Intermodalism Sustainable Livability Safety One DOT Jobs Coordination Multimodalism