Protein Structure Assessment
560 likes | 859 Views
Protein Structure Assessment. Judgment day. Topic 6. Chapter 14 & 15, Du and Bourne “Structural Bioinformatics”. Beautiful Structures, Aren’t They?.

Protein Structure Assessment
E N D
Presentation Transcript
Protein Structure Assessment Judgment day. Topic 6 Chapter 14 & 15, Du and Bourne “Structural Bioinformatics”
For high profile structures, they are not merely contaminations in PDB if serious errors occur. In this case, a software bug “flipped” two columns of data, inverting the electron density map. ABC transporter Science, 314:1856, 2006
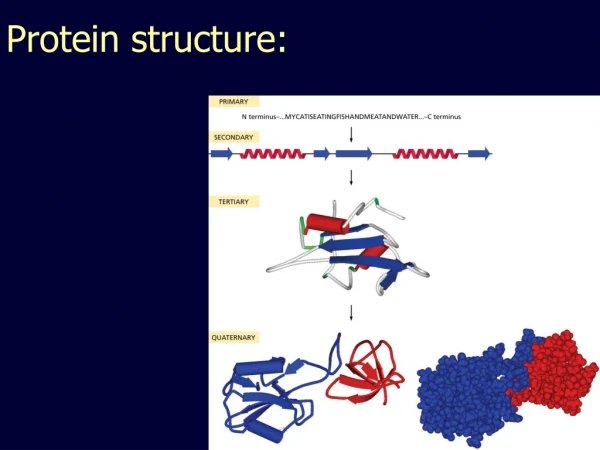
Experimental Methods for Structure Determination Steps in Structure Determination using X-ray Crystallography Models! Steps in Structure Determination using NMR Image from “Protein Structure and Function” by Gregory A Petsko and Dagmar Ringe
Structure Assessment and Validation, Why? • The process involves instrumentation, methodology, software, • experimental procedures....., so random and systematic error scan occur. • Experimental errors vs. interpretation errors. • Limitation of data vs. subjectivity • “Given the same data, no two crystallographers will ever produce • identical final models” –Kleywegt GL • Local errors vs. global errors
Global Quality Parameters for X-ray Structures Rules of Thump for high quality X-ray structures: resolution 2.0 Å or better and R-factor: 0.2 or less
R-factor for X-ray Structures The agreement between the diffraction data and the model is measured by R-factor: F: structural factor • R-free: about 10% of the observations are removed from the data set before refinement. Then, refinement is performed using the remaining 90%. The R-free value is calculated to see how well the model predicts the 10% that were not used in refinement, leading to a less biasedquantity.
Serious Structural Errors Blue: N-terminal Red: C-terminal 1PHY 2PHY PHOTOACTIVE YELLOW PROTEIN 1PHY was solved in 1989, the entire backbone trace is incorrect. 2PHY was solved in 1995. RMSD between 1PHY and 2PHY ~15 Å. Kleywegt GJ., “Validation of protein crystal structures”, ActaCryst, 2000, D56, 249-265
Serious Structural Errors Blue: N-terminal Red: C-terminal 1PTE 3PTE • Secondary structure assignments are correct • Topology is incorrect Kleywegt GJ., “Validation of protein crystal structures”, ActaCryst, 2000, D56, 249-265
Major Errors from NMR Spectroscopy Sequence and Structure Ensembles of Two DLC2A Structures 96% identity A, D: human (1TGQ) B, C: Mouse (1Y4O) Intermolecular contacts vs. intramolecular contacts Nabuurs, et al Plos Computational Biology 2(2), 2006
Major Errors from NMR Spectroscopy Intermolecular contacts vs. intramolecular contacts From Nabuurs, et al Plos Computational Biology 2(2), 2006… The observed pattern of dispersed signals, ideally one for each amino acid, provides a “fingerprint” of the protein. However, the formation of a symmetric dimer, as shown in Figure 1A, does not result in a doubling of the number of observed NMR signals. Consequently, it is not straightforward to determine the oligomeric state of a protein from its 15N-HSQC NMR spectra alone, and typically assessments have to be made from estimates of the protein's relaxation rates [26]. Therefore, if the oligomeric state of a protein is not known or is incorrectly known, the NMR spectra of a dimeric protein could be easily interpreted as originating from a monomer.
Other common errors, which tend to be less severe Flipped residues -- Asn, Gln, and His. Missing sidechain atoms-- especially in longer-chain, solvent-exposed residues (i.e., lysine and arginine). Missing backbone atoms -- especially in loop regions. Truncated or incomplete chains -- the “PDB sequence” rarely matches perfectly with the sequence encoded by structure. The truncation is generally at the termini ends. SEVERITY
Flipping: Problems with Gln/Asn/His ActaCryst. (2010). D66, 12-21
The What of Validation/Assessment • It should be independent of experimental data • Many criteria that are based on straightforward chemical ideals and physics can be used to validate protein structure quality. • For example, Ramachandran plots, side-chain torsion angles, and contactsare widely used. • Other order parameters that can also be used: H-bonding, chirality, bond angles and distances etc. • Physics-based energy values, calculated using energy potentials. • There are programs available for assessment of protein structure quality: • ProCheck (stereochemistry, Ramachandran plots); ProsaII(energy check); MolProbity (bumps and contacts); WhatIF (all of the above) There is no one correct way to measure quality!
Empirical vs. first principles In both cases, we establish what are the structural parameters of importance (i.e., bond lengths and steric clashes, phi/psi angles, etc.). In empirical methods, we use observed values to establish normal ranges and look for exceptions (which are considered poor quality). In first principles methods, we start from the fundamental physics and write out an energy function to quantify the energy of the structure.
Geometry and Stereochemistry: Ramachandran plots retinoic acid binding protein II Kleywegt GJ., “Validation of protein crystal structures”, ActaCryst, 2000, D56, 249-265
More About Ramachandran Plots Left: Ramachandran plot of a wrong structure Right: Ramachandran values for D-amino acids will look different from L-amino acids. For example, Gramicidin A (1GRM), a prokaryotic antibiotic compound, is composed of alternating L/D amino acids. Left: Kleywegt GJ., ActaCryst, 2000, D56, 249-265
Geometry and Stereochemistry: PROCHECK • Checks the stereochemical quality of a protein structure • Produces a number of PostScript plots analyzing its overall and residue-by-residue geometry
Geometry and Stereochemistry: PROCHECK http://services.mbi.ucla.edu/SAVES/
Geometry and Stereochemistry: PROCHECK G-factors mapped to structure, in this case, red = unusual phi/psi angles
http://molprobity.biochem.duke.edu/index.php Davis, IW et al.
Energy Plot: ProSA Analysis ProSA is based on a potential of mean force (aka, knowledge-based potential) that uses observed residue-residue pairwise distances to establish energy values. From the ProSA webserver site: ProSA-web provides an easy-to-use interface to the program ProSA (Sippl 1993), which is frequently employed in protein structure validation. ProSAcalculates an overall quality score for a specific input structure. If this score is outside a range characteristic for native proteins the structure probably contains errors. A plot of local quality scores points to problematic parts of the model which are also highlighted in a 3D molecule viewer to facilitate their detection.
Energy Plot: ProSA Analysis From the ProSA webserver site: The z-score indicates overall model quality. Its value is displayed in a plot that contains the z-scores of all experimentally determined protein chains in current PDB. In this plot, groups of structures from different sources (X-ray, NMR) are distinguished by different colors. It can be used to check whether the z-score of the input structure is within the range of scores typically found for native proteins of similar size. Z = -5.65 NOTICE THE QUALITY DIFFERENCE BETWEEN X-RAY AND NMR.
Energy Plot: ProSA Analysis 1JSQA 2HYDA
Anomalous bond angles: Structure Validation Menu: Name check: Checks the nomenclature of torsion angles. Coarse Packing Quality: Checks the normality of the local environment of amino acids Anomalous bond lengths: Lists bond lengths that deviate more than 4 sigma from normal. Planarity: Checks if planar groups are planar enough. Fine Packing Quality Control: Checks the normality of the local environment of amino acids Collisions with symmetry axes: Lists atoms that are too close to symmetry axes. Hand check: Lists atoms with a chirality that deviates more than 4 sigma from normal. Ramachandran plot evaluation: Determines the quality of a Ramachandran plot. Omega: Checks if the distribution of omega angles is normal. Proline puckering: Checks if proline pucker falls in a normal range. Anomalous bond angles: Lists bond angles that deviate more than 4 sigma from normal. Checking water & ion: Lists ions that might be waters (and vice versa), or other ions. http://swift.cmbi.ru.nl/servers/html/index.html z-score
Theoretical basis of molecular mechanical force fields • The validity of molecular mechanics is based on two key assumptions: • The Born-Oppenheimer approximation– enables the electronic and nuclear energy to be separated: the much smaller mass of the electrons means that they can rapidly adjust to any change in nuclear positions. Consequently, the energy of the molecule (in its ground state!) can be considered a function of the nuclear coordinates only. • (2)Transferability– enables a set of parameters developed and tested on a relatively small dataset to be applied to a much wider range of chemical problems.
Molecular mechanics Molecular Mechanics (MM) is a computational technique used to model the conformational behavior and energetic properties of molecules. The molecule is treated at the atomic level, i.e. the electrons are not treated explicitly. MM uses an Energy Function, defined so that given a particular conformation, (i.e. given a set of spatial coordinates for all the atoms) the energy of the molecule can be calculated. Most MM models cannot describe dissociation of covalent bonds. The energy function is empirical, i.e. it is not entirely derived from rigorous theories. Usually, a combination of quantum mechanical calculations and experimental data are used to construct the energy function.
A simple force field Many of the MM force fields in use today can be interpolated in terms of a relatively simple four-component picture of the intra- and inter- molecular forces within the system. Energetic penalties are associated with the deviation of bond lengths (aka, central forces) and anglesaway from their “reference” values, there is a function that describes how the energy changes as bonds (torsions) are rotated, and finally the force field contains terms that describe interaction between non-bonded parts of the system.
More sophisticated force fields More sophisticated force fields may have additional terms (such as polarizability, improper torsions, etc.), but invariably contain these four components. An attractive feature of this representation is that the various terms can be ascribed to changes in specific internal coordinates (i.e., bond lengths, angles, torsion angles, or movements of atoms relative to each other).
Notes Hooke’s law, U = 1/2·k·x2 Hooke’s law, U = 1/2·k·x2 We will ignore improper torsions Sinusoidal potential. Note the three minima, which depending on the local chemistry, may or may not be equally deep. Positive (destabilizing) values when ++ or --. Morse curve.
Potential energy Bond stretching Inreality, the bond stretching potential would be best approximated by the Morse potential, yet is some cases a Harmonic potential (Hooke’s law) is used.
Bond length and energy deviations from equilibrium values • Vb = 0.5 · Kb(r-req)2 • Kb = 500-1200 kcal/mol/Å2 • Bond length changes of 0.05 Å implies 1.5 kcal/mol.
Angle bending The deviation of bond angles is modeled with the Harmonic potential (Hook’s law). The contribution of each angle is characterized by a force constant and a reference value. Meaning, less energy is required to perturb the equilibrium angle a small bit. Additionally, the force constant here is much less than that used in the bond stretching potentials. Meaning, bond angles deviate more frequently than bond lengths. Higher order terms can be included here as well to model more pathological systems, but they generally are not employed.
Bond angle and energy deviations from equilibrium values • Vb = 0.5 · Ka(- eq)2 • Kb = 80 kcal/mol/radian2
Torsional terms The bond stretching and angle bending terms are often referred to as the hard degrees of freedom, meaning that substantial energies are required to cause significant deformations. Most of the variation in chemical structure and relative energies is due to the complex interplay between the torsional and non-bonded terms. The existence of barriers to rotation about chemical bonds is fundamental to our understanding the structural properties of molecules and conformational analysis. The three minimum energy staggered conformations (1 anti and 2 gauche) and three maximum energy eclipsedconformations of ethane are a classic example of this.
Torsional terms Torsion angle potentials are almost always expressed as a cosine expansion. Vn is often referred to as the barrier height, however to do so is misleading. The barrier is directly proportional to the sum of V’s when more than one term is present in the expansion. Moreover, other terms contribute to the barrier height as a bond is rotated, especially the non-bonded interactions between atoms 1 & 4. Having said this, the term does give a qualitative indication of the relative barriers to rotation.
Torsional terms 4 Note: 1 kcal = 4.184 kJ 3 2 Potential Energy (KJ/mol) 1 0 -1 0 60 120 180 240 300 360 Torsion angle
Attractive non-bonded potentials • Attractive London dispersion (VDW) forces • Induced dipole • Varies as 1/r6 • Can be computed “exactly” • Aijdepends STRONGLY on chemistry
Repulsive non-bonded potentials • Repulsive forces (two particles occupying the same space) • Exponential (Morse) or power law • V minimum at RVDW determines B from A • A can be set from depth of well • Parameters thus determined from depth and position of minimum alone. where is the depth of the potential well and is the (finite) distance at which the interparticle potential is zero and r is the distance between the particles. Attractive term Repulsive term
In practice, a truncated potential is used to increase compute efficiency • To reduce compute time, the LJ potential is often truncated at the cut-off distance of rc = 2.5, because VVDW = 0!!!
Electrostatic interactions • Partial charges are known to exist. • In fact, peptide has a dipole moment of 3.7 D. • Terms are small, but there are LOTS of them. • Dielectric “constant” is a major problem. • Constant at short range • = r at longer distances
An aside: Electrostatic interactions Note that the electrostatic interactions don’t die off abruptly since they are linear with separation distance. Nevertheless, because the non-bonded terms are the most compute intensive (there are N·(N-1)/2 atom pairs!), cut-off values may be frequently employed to speed up computation time. (This is especially critical when coupled to a minimization algorithm or dynamics simulations) However, doing so cause the long-range (weaker) electrostatic interactions to be ignored, which is a cause of significant model error. As such, reaction field methods, Ewald summation, particle mesh Ewald, etc. are used to account for the long-range effects.