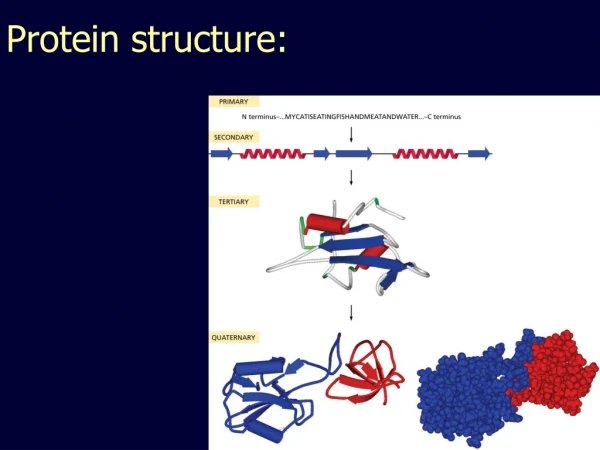
PROTEIN STRUCTURE
PROTEIN STRUCTURE. NAME: ANUSHA. INTRODUCTION. Frederick Sanger was awarded his first Nobel Prize for determining the amino acid sequence of insulin, the protein needed by people suffering from Diabetics.

PROTEIN STRUCTURE
E N D
Presentation Transcript
PROTEIN STRUCTURE NAME: ANUSHA
INTRODUCTION • Frederick Sanger was awarded his first Nobel Prize for determining the amino acid sequence of insulin, the protein needed by people suffering from Diabetics. • Each protein has a different functionality, like the brain cells need a different protein to function than the liver cells do.
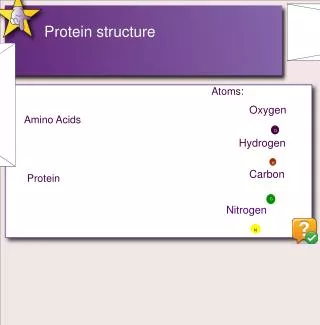
Amino Acids vs Nucleic Acids They are composed of one carboxyl group and one or more amino group There are 20 different types of amino acids They are the building blocks of all proteins. They are linked by peptide bonds to form protein. Example: They are composed of sugar, nitrogenous base and phosphate group. The two types of nucleic acids are DNA and RNA. DNA is the genetic material. RNA is mainly responsible for protein synthesis and is genetic material in some viruses.
Protein Sequencing and Identification • There are two computational problems for protein sequencing : • De novo protein sequencing • Protein identification. • Example: A biologist wants to determine the protein that form the DNA Polymerase complex in Rats.
Mass Spectrometer • Protease, e.g. Trypsin, breaks the protein into peptides. • A Tandem Mass Spectrometer further breaks the peptides down into fragment ions and measures the mass of each piece. • Mass Spectrum of a peptide is a collection of masses of these fragments • Mass Spectrometer electrically accelerates the fragmented ions; heavier ions accelerate slower than lighter ones. • Mass Spectrometers measure mass/charge ratio of an ion.
Mass Spectrometry • First the components are separated by Electrophoresis. • The isolated proteins are digested by Trypsin to produce peptide fragments with relative molecular masses.
Protein Backbone: Breaking the Protein:
Trypsin breaks after Lys and Arg residues. • Given a typical amino acid composition, a protein of 500 residues yields about 50 Tryptic fragments. • The mass spectrometer measures the masses of the fragments with very high accuracy
Peptide Sequencing Problem • Tandem Mass Spectrometry (MS/MS): mainly generates partial N- terminal and C- terminal peptides. • Spectrum consists of different ion types because peptides can be broken in several parts. • Chemical noise often complicates the spectrum. • Represented in 2D :mass/charge axis vs intensity
While breaking into & it may lose some small parts of & , results in fragments of a lower mass. • For example, the peptides might lose water (H2O), and the peptides loses an ammonia (NH3 ). • The resulting Masses detected by the spectrometer will be equal to the mass of minus the mass of H2O, and mass of minus the NH3 , etc
Fragment pattern of peptide Two different types of fragment ions b-ions and y-ions. When the carbon nitrogen bond breaks in the spectrometer each of these ion type will lose water or ammonia or both.
Spectrum Graph • This is one of the approach for solving the Peptide Sequencing Problem. • In this approach we construct a graph from the experimental spectrum. • Example : • Consider an Experimental spectrum S = {s1,…..,sq} N-terminal ions. • We generate K different guesses for each of masses in the experimental spectrum. • Every guess s = x – δj where x is the mass of some partial peptide and 1<= j <= k. • For every mass x in the experimental spectrum ,there are k guesses for the mass x of some partial peptide : s + δ1,s + δ2,…….,s + δk.
Each mass in the experimental spectrum is transformed into a set of k vertices in the spectrum graph. • The vertex for δifor the mass s is labeled with mass s + δi • Then we connect two vertices u and v in the graph by the directed edge(u,v), if the mass of v is larger than that of u. • If we add a vertex at 0 and a vertex at parent mass m. Then we have to find a path from 0 to m. • The spectrum graph may have at most qk+2 vertices. • Edges of the spectrum graph by the amino acid whose mass is equal to difference between vertex masses. • This shows that the Peptide Sequencing problem as one of the finding the “correct” path in the set of all the paths between the two vertices in the directed acyclic graph.
Protein Identification via Database Search • De novo peptide sequencing is invaluable for identification of unknown proteins • However , de novo algorithm are designed for working with high quality spectra with good fragmentation and without modification. • Another approach is to compare a spectrum against a set of known spectra in a database.
Protein Identification Problem • Input : A database of proteins, an experimental spectrum S, a set of ions types ∆, and a parent mass m. • Output: A protein of mass m from the database with the best match to spectrum S.
MS/MS Database search • Database search in the mass-spectrometry has been very successful in identification of already know proteins. • Experimental spectrum can be compared with the theoretical spectra database peptides to find the best fit. • SEQUEST is one for the popular algorithm it determines whether a database entry matches an experimental spectrum. The basic approach of this algorithm is just a linear search through the database. • The drawback to MS/MS database search algorithm like SEQUEST is that peptides in a cell are often slightly different from the canonical peptides present in the database.
Modified Protein Identification Problem • Input : Experimental spectrum S Database of Peptides parameter k( number of modification) A set of ion types ∆ Parent mass m. • Output : A protein of mass m with the best match to spectrum S that is at most K modifications away from an entry in the database . • The drawback of the modified protein identification problem is that very similar peptides may have very different spectra • Goal : define a notion of spectral similarity that correlates well with the sequence similarity. • If peptides are few modification s apart, then the spectral similarity between them should be high.
Spectral Convolution • It is the number of masses common to both spectral S1 and S2. is simply .. • MS/MS database search algorithms that maximizes , is the theoretical spectrum and is the experimental spectrum. • If peptides P1 and P2 differ by only one mutation with amino acid difference δ = m(p2) – m(p1) then is expected to have approximately equal peaks at x =0 and x = δ.
Example: be a spectrum of peptide P, and assume that P produces only b-ions Let: and Which of the peptides fits the S best? Shared peak count : since both S’ and S’’ have 5 peaks in common with S. Spectral convolution : S ϴ S’ and S ϴ S’’ have strong peaks of same heights at 0 and 5. This reveals that both P’ and P ‘’ can be obtained from P by single mutation with mass difference of 5
S1 and S2 are the theoretical spectra of the peptide PRTEIN and PRTEYN respectively. The Elements in the spectral convolution that have multiplicity > 2 are shaded, while the elements with multiplicity = 2 are circled. The high multiplicity element 0 are shaded in red , other higher element 50 in green due to the shift in the masses by δ = 50 due to the mutation of I and Y in PRTEIN
Protein Folding • DNA to RNA to Protein • Protein folding. • Why do Protein Folds? Why is folding Important?
Conclusion • Tandem Mass spectrometry • De novo Peptide Sequencing • Spectrum Graph • Protein identification via Database Search • Spectral Convolution • Protein Folding.
References • An introduction to Bioinformatics Algorithm by Neil C. Jones and Pavel A. Pevzner. • Introduction to bioinformatics – Arthur M.Lesk